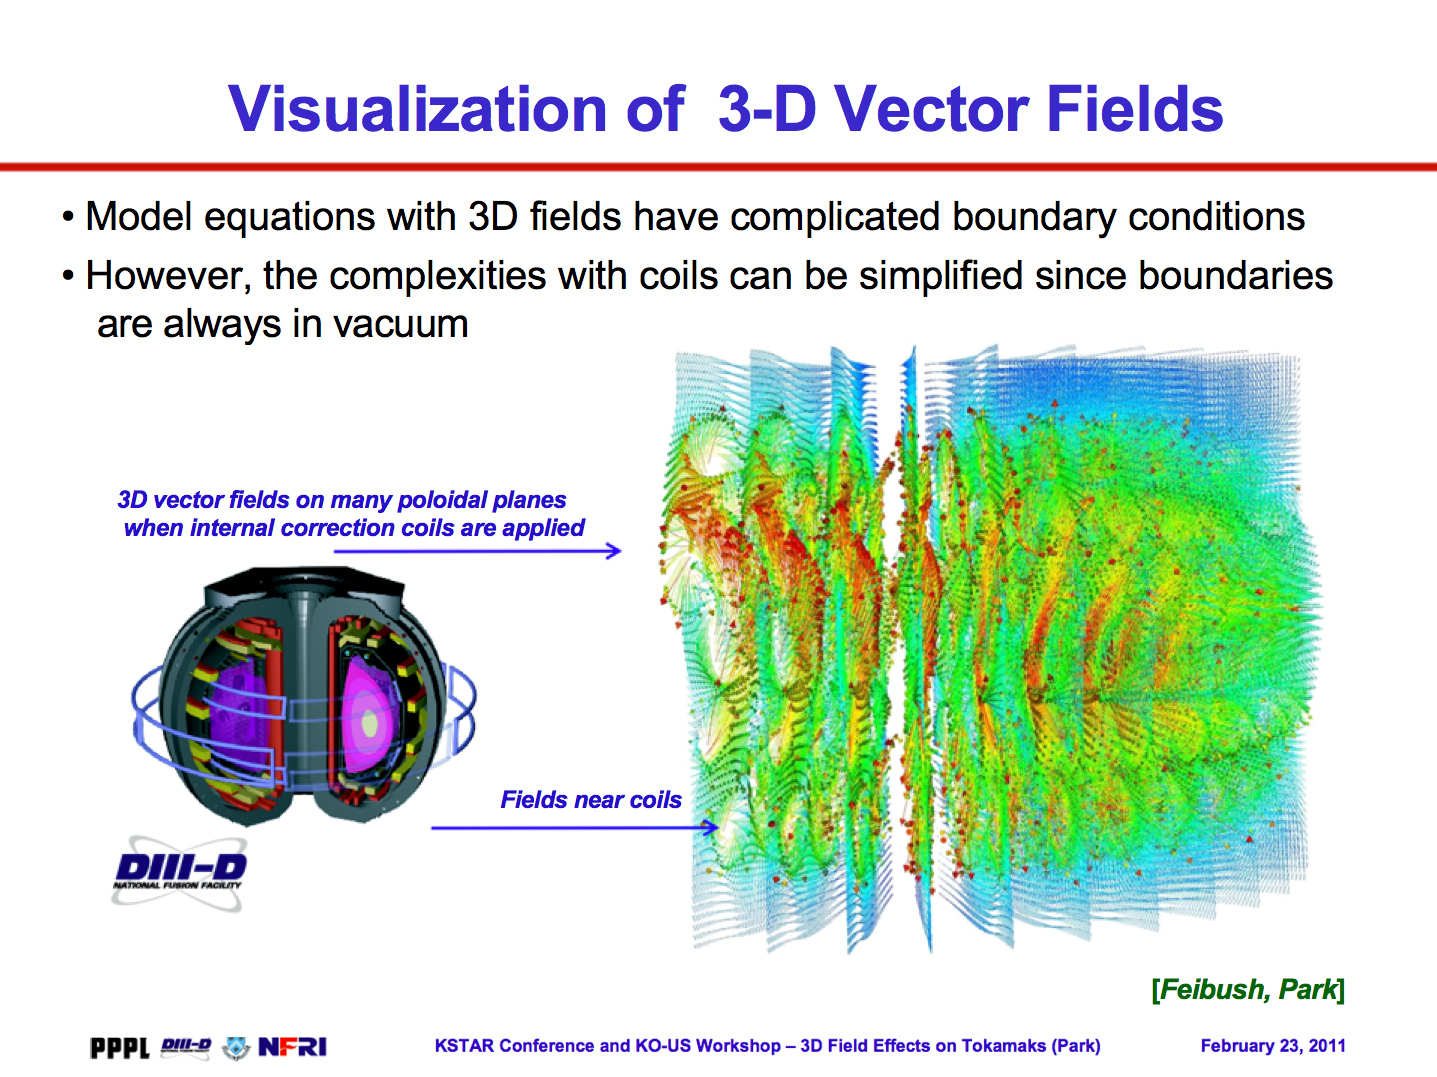
Figure 1: Two poloidal planes that are 90 degrees apart.
The data is modeled by Jong-Kyu Park. Graphics rendered by Eliot
Feibush using the Visit visualization software.
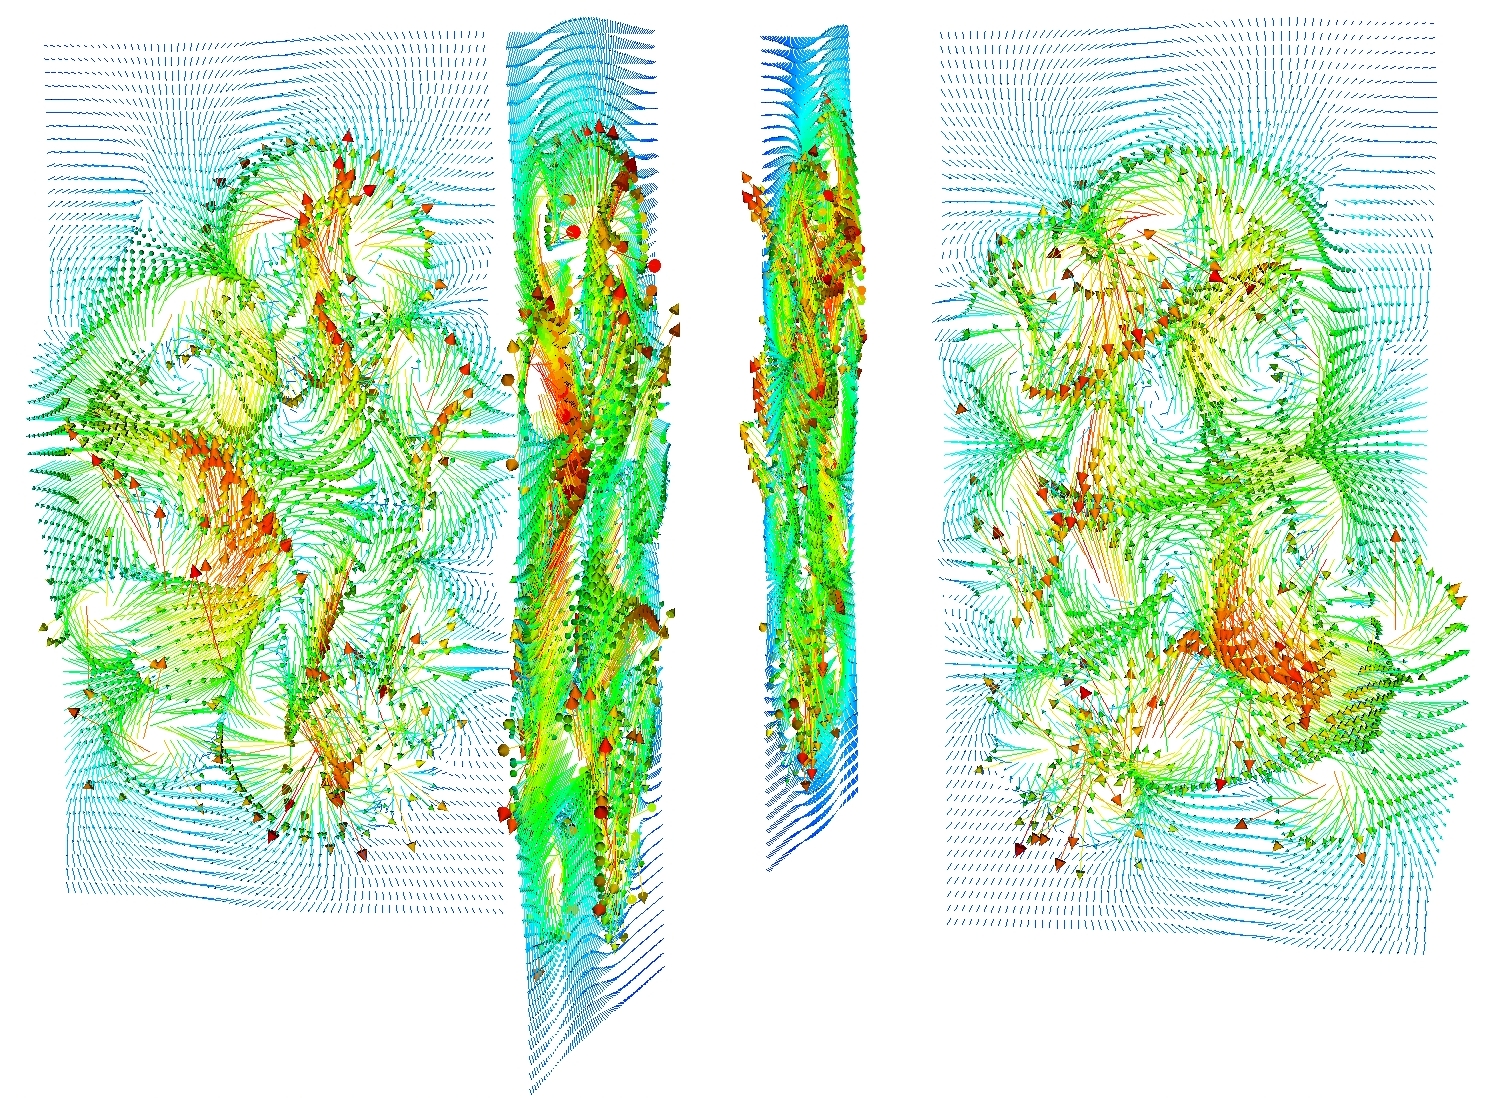
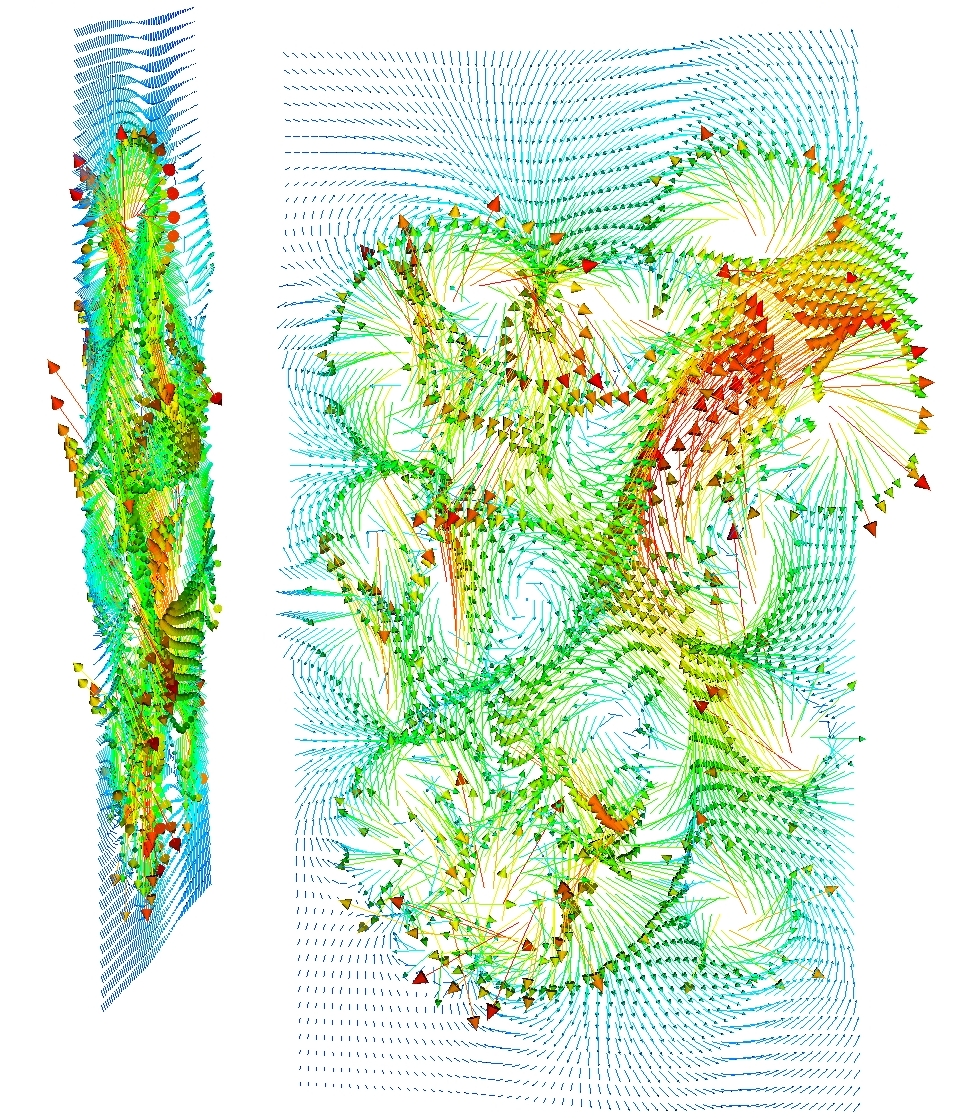
Figure 2: Four poloidal planes. The start of each vector is
on a grid point in the plane. The model computes the end point of
the vector which might not be in the plane so 3-D visualization is
effective.
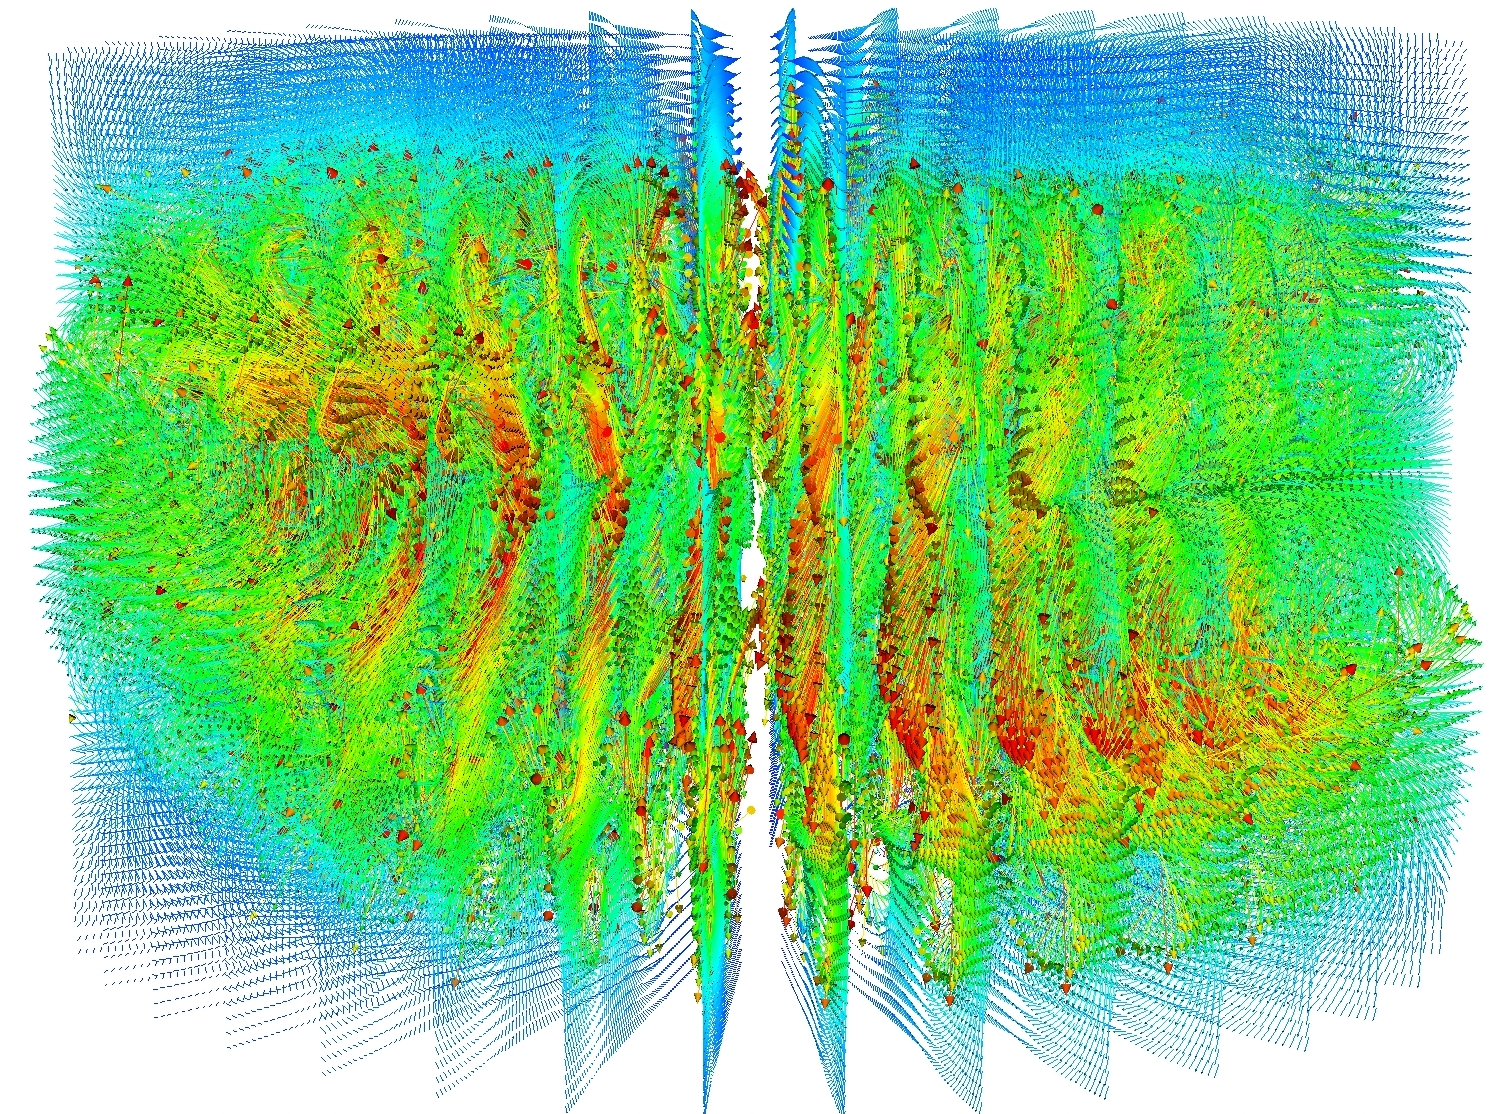
Figure 3: The torus can be perceived despite the data
density.
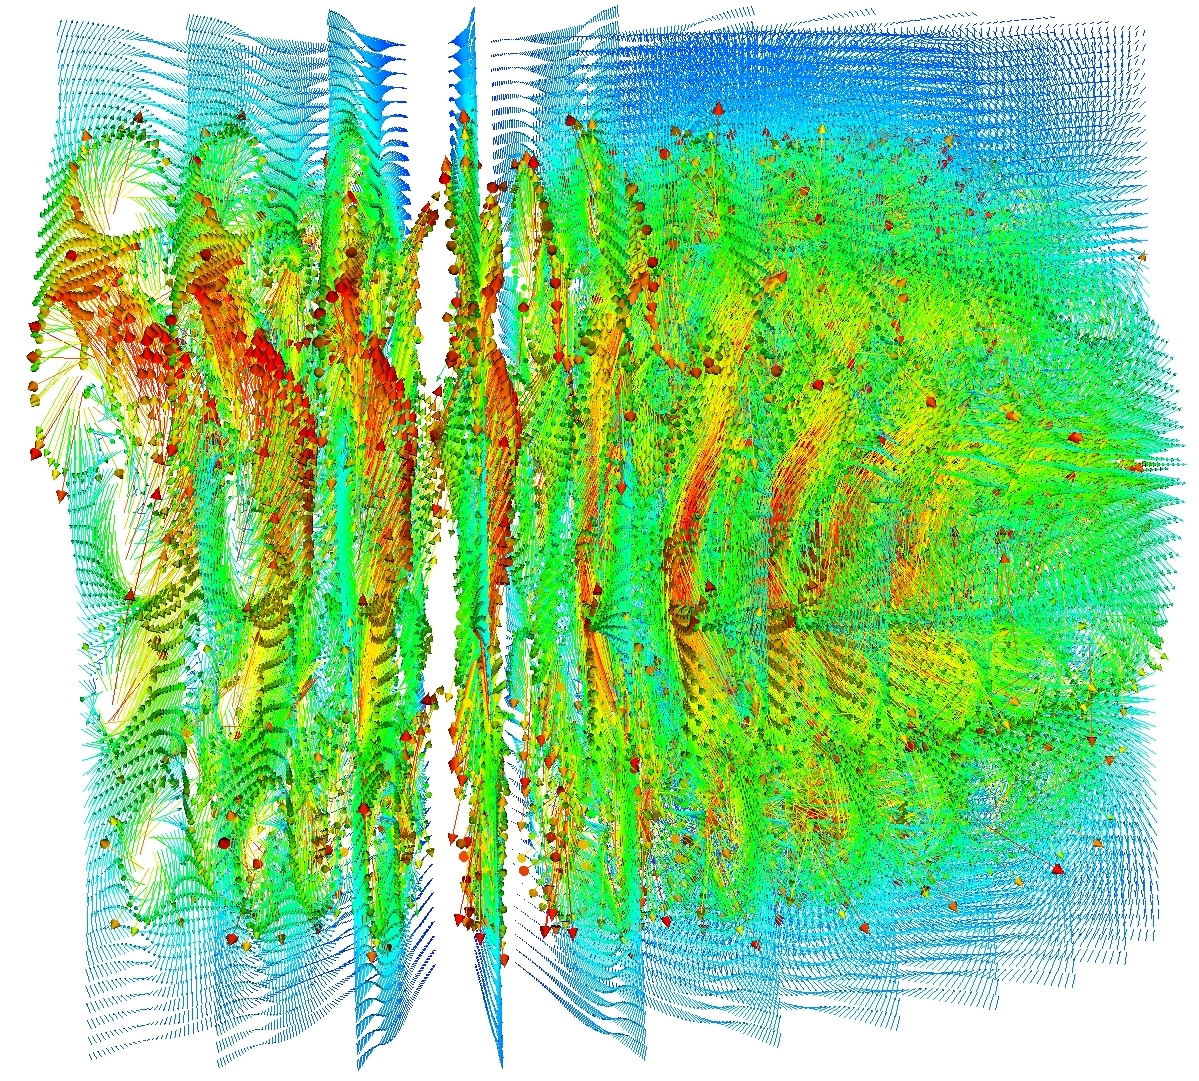
Figure 4: Looking from outside the torus, some of the planes have
been removed. The effects of the magnetic coils are visible.