1. Running RPLOT from ElVis
The TRANSP RPLOT program is
integrated with ElVis. RPLOT's basic function consists of
an xterm command line window and an xterm display window.
RPLOT has been extended to send its graphs to ElVis for enhanced
display:
1.1 ElVis on Linux or Mac
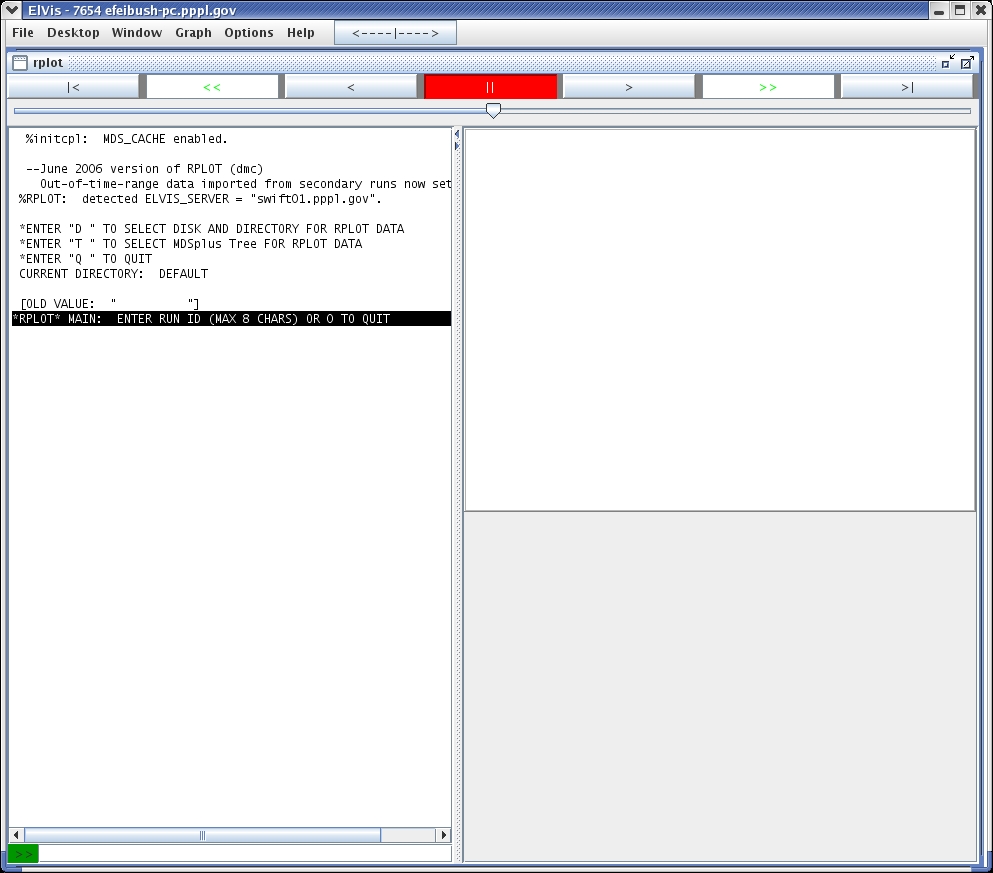
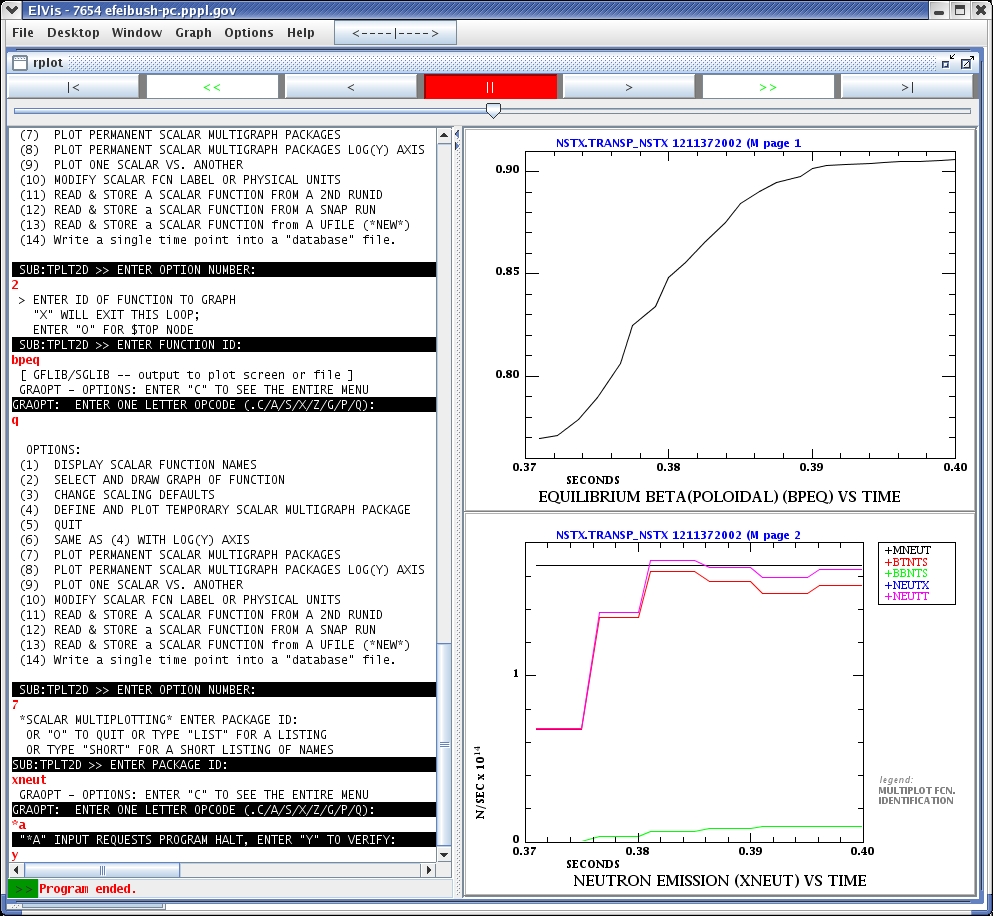
To start an RPLOT session, run ElVis and go to: Desktop --> RPLOT. If you are running ElVis on Linux or a Mac then select the menu item for ssh portal... This brings up a dialog box where you can specify RPLOT's working directory on the PPL file system. When you click OK, ElVis will start an ssh to portal, cd to the working directory, start RPLOT in an xterm, and connect it to ElVis. You will see the legacy RLOT command window and display window in addition to ElVis, as shown:
The working directory specified in ElVis will be saved as a preference when you exit. It will be the default directory when you run ElVis again.
1.2 ElVis on Windows
If you are running ElVis on Windows then you must also have software, such as Cygwin/X, that will make an ssh connection and support an xterm coming from the cluster. Install and run ElVis from a Cygwin xterm. This will put the Cygwin ssh program in ElVis's executable path. Go to: Desktop --> RLOT --> local command... This brings up a dialog box for entering a Windows command such as:
c:\cygwin\bin\ssh -X fusiongrid /p/fgweb/bin/elvisrplot.csh localName portNumber workDir.
The portNumber is shown in the ElVis titlebar. It is usually 7654. The localName of your computer is also shown in the titlebar following the port number. The workDir is your desired working directory on the PPL file system.
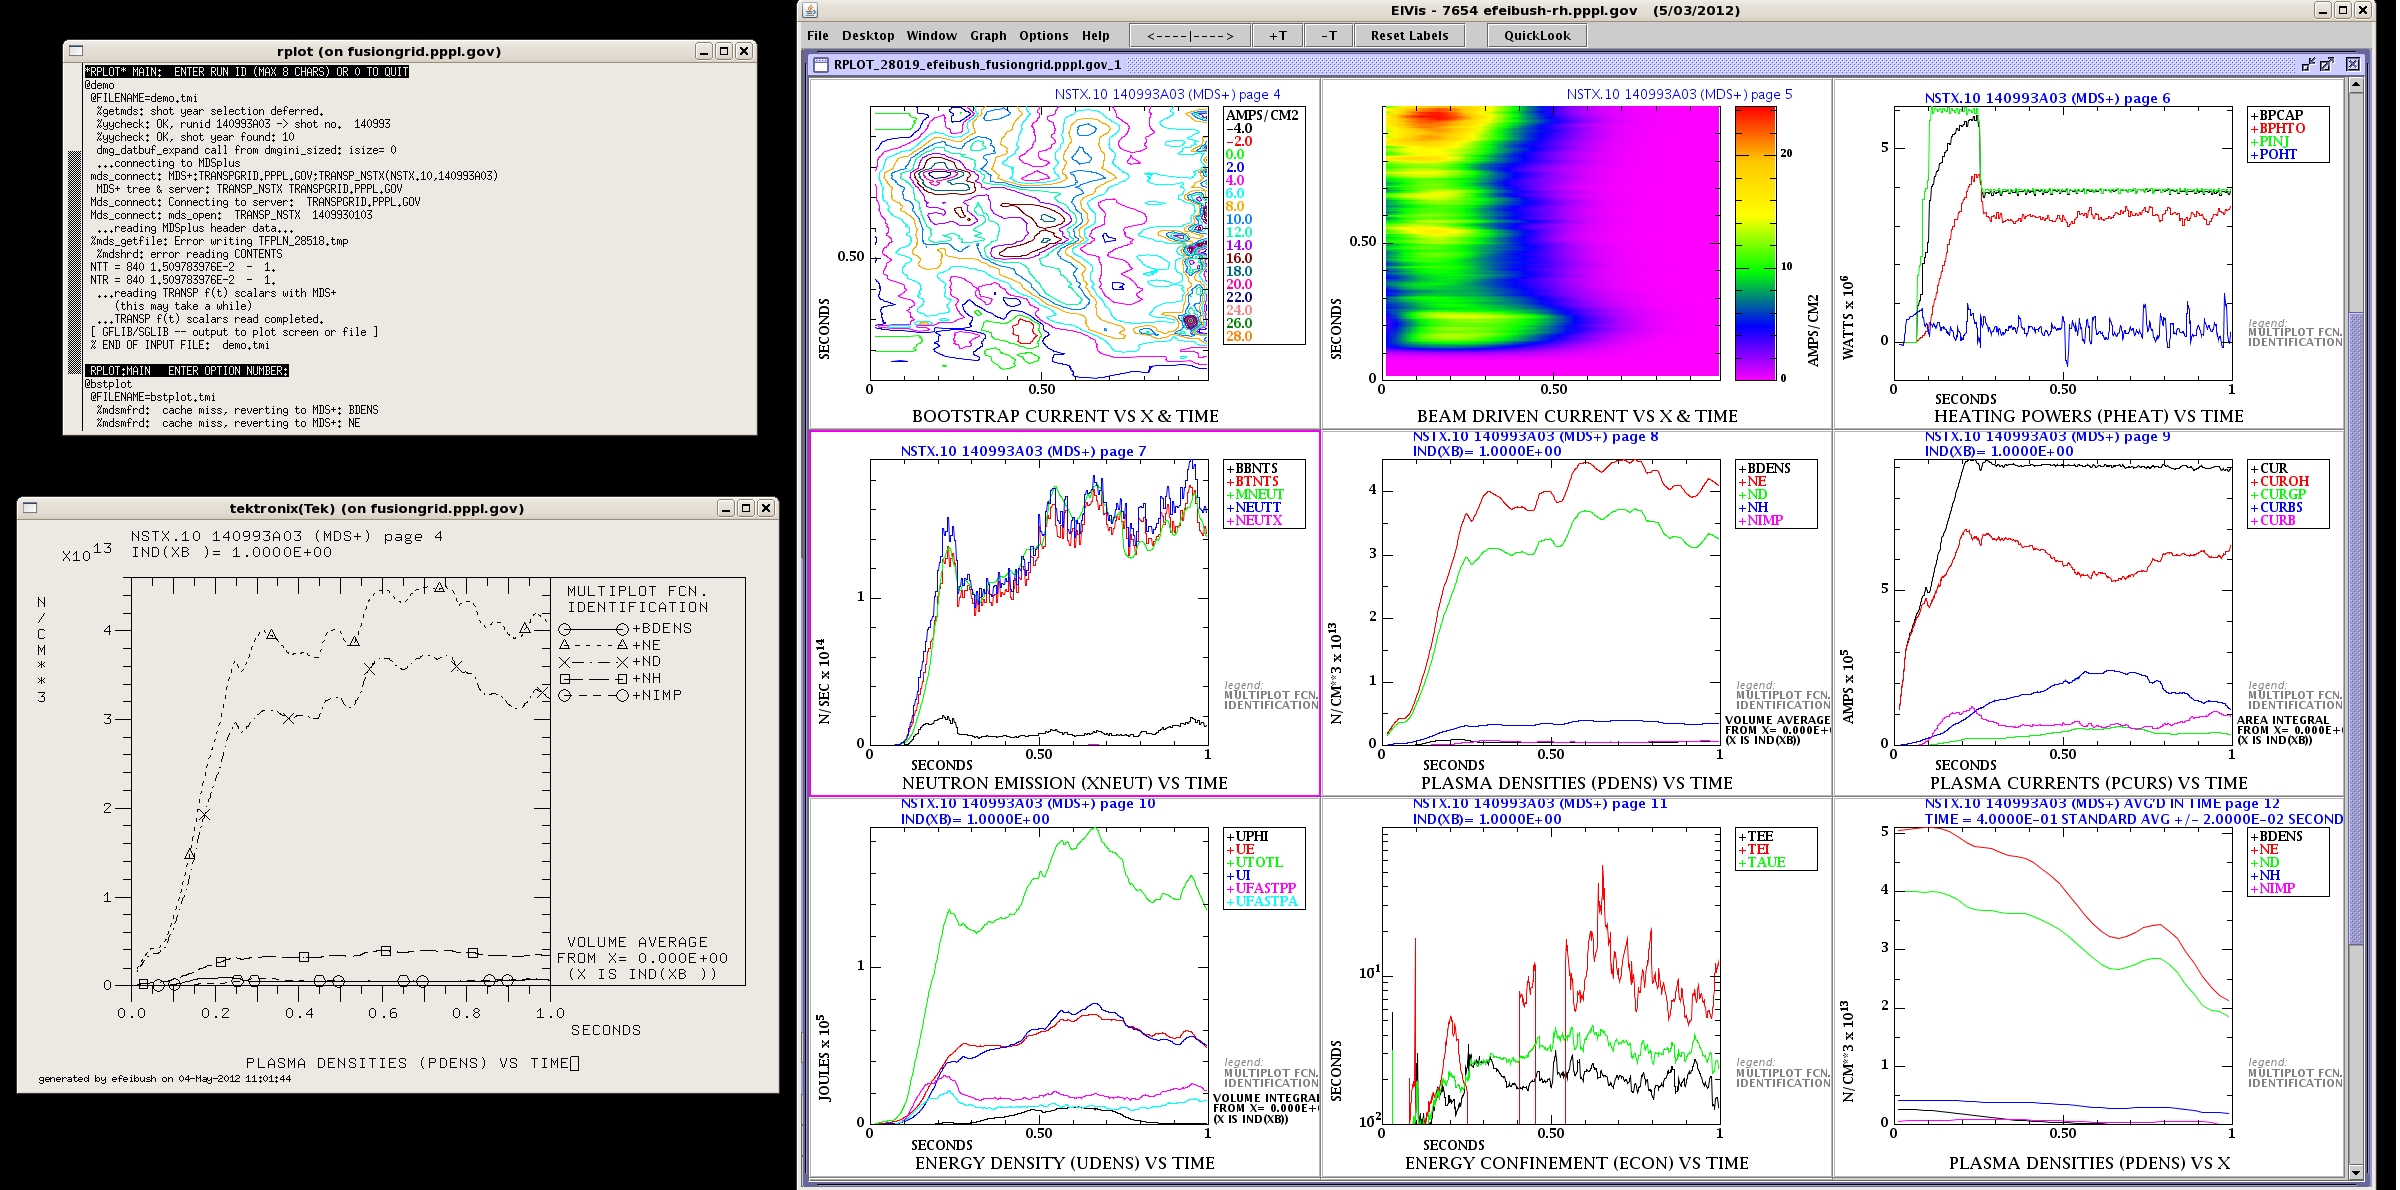
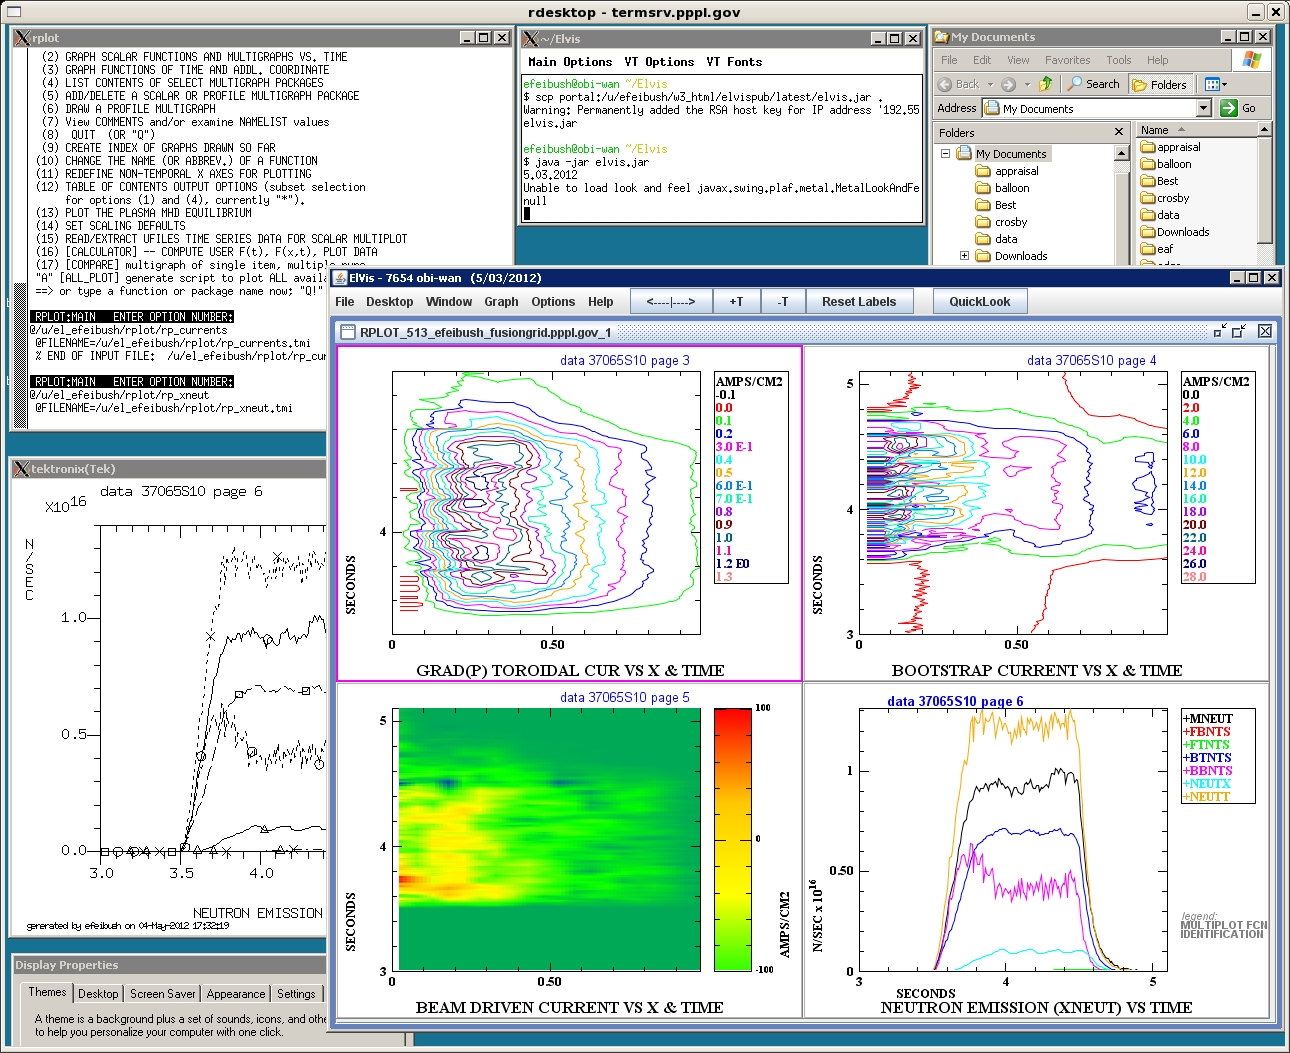
Running RPLOT from ElVis assumes that your computer can make a socket connection to the PPL portal cluster. You must be logged in to your computer with your PPL account name. Here is a screenshot of a Windows computer running Cygwin/X. ElVis has been started from the xterm command line. A local command was entered to run rplot via ssh and connect to ElVis running on Windows:
1.3 ElVis in nx
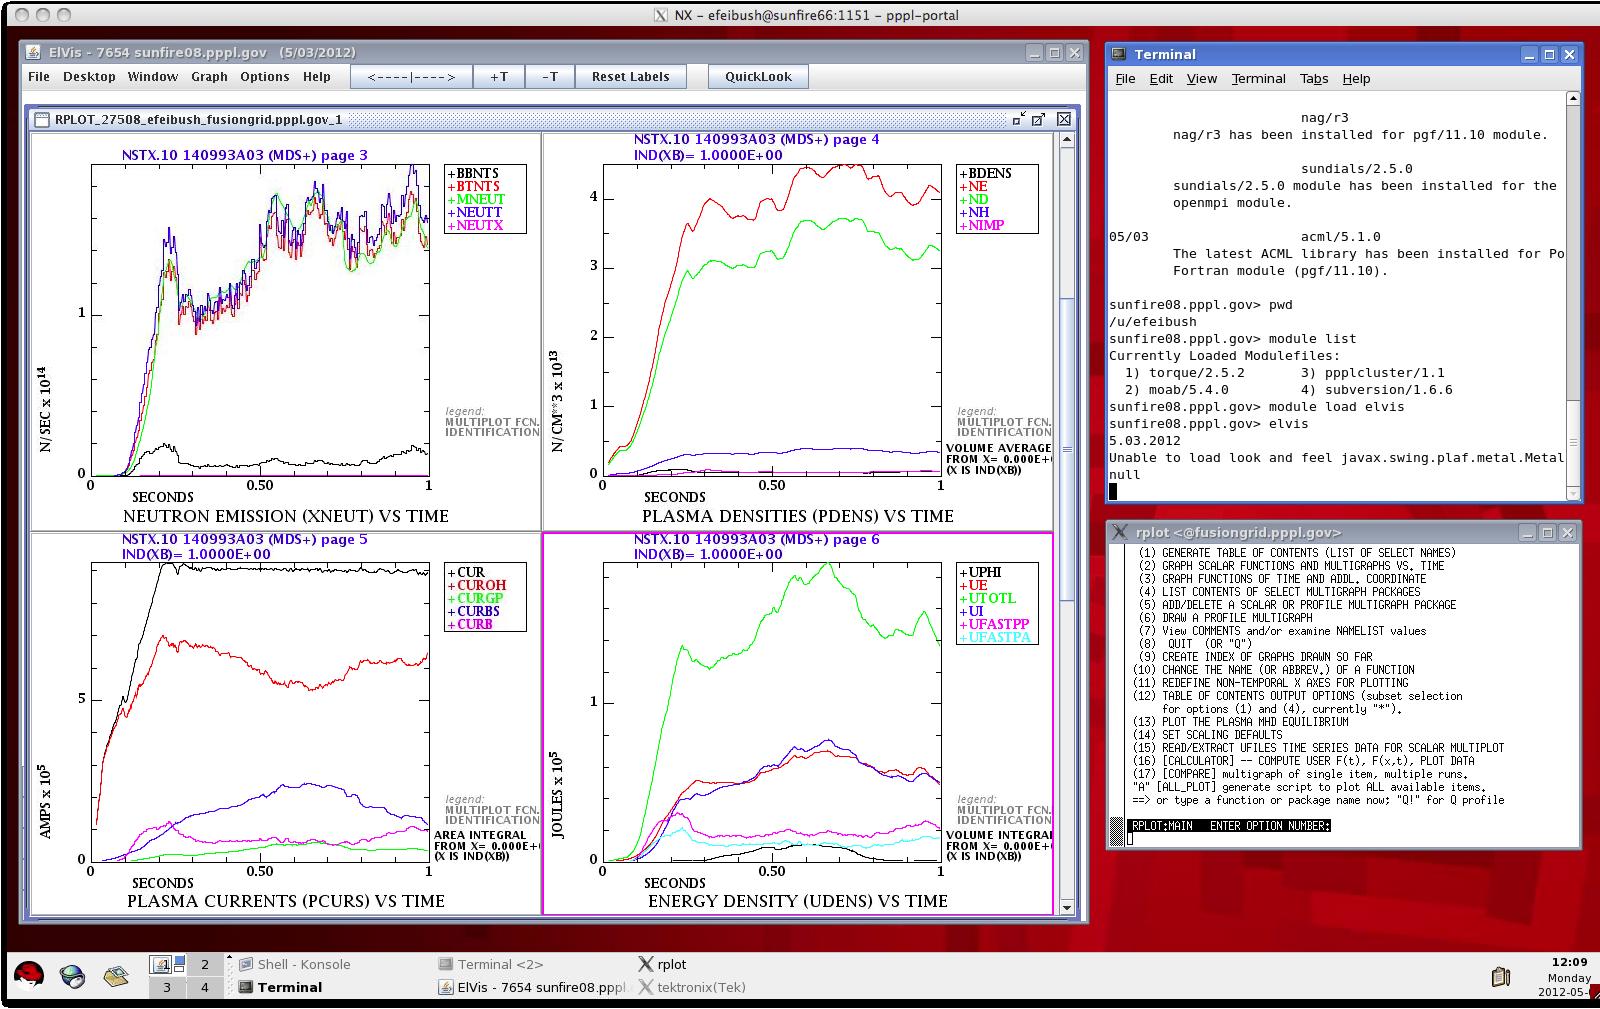
Another approach is to run the nx client on your local computer and connect to the nx server on cportal.pppl.gov. This provides a graphical desktop on the PPL cluster. Now you can run ElVis on the cluster although the user interface will be slower than running ElVis directly on your local computer. Here is a screenshot of ElVis running within the nx client:
1. Multiple, simultaneous
graphs.
2. Color plots.
3. Interactive data exploration: pan, zoom, dynamic numerical readout, interactive log plots.
4. Variety of presentation styles for f(x,t) data.
5. Publication quality output to PostScript or PDF files.
6. Animation of multi-dimensional data.
2. Color plots.
3. Interactive data exploration: pan, zoom, dynamic numerical readout, interactive log plots.
4. Variety of presentation styles for f(x,t) data.
5. Publication quality output to PostScript or PDF files.
6. Animation of multi-dimensional data.
1.1 ElVis on Linux or Mac
To start an RPLOT session, run ElVis and go to: Desktop --> RPLOT. If you are running ElVis on Linux or a Mac then select the menu item for ssh portal... This brings up a dialog box where you can specify RPLOT's working directory on the PPL file system. When you click OK, ElVis will start an ssh to portal, cd to the working directory, start RPLOT in an xterm, and connect it to ElVis. You will see the legacy RLOT command window and display window in addition to ElVis, as shown:
The working directory specified in ElVis will be saved as a preference when you exit. It will be the default directory when you run ElVis again.
1.2 ElVis on Windows
If you are running ElVis on Windows then you must also have software, such as Cygwin/X, that will make an ssh connection and support an xterm coming from the cluster. Install and run ElVis from a Cygwin xterm. This will put the Cygwin ssh program in ElVis's executable path. Go to: Desktop --> RLOT --> local command... This brings up a dialog box for entering a Windows command such as:
c:\cygwin\bin\ssh -X fusiongrid /p/fgweb/bin/elvisrplot.csh localName portNumber workDir.
The portNumber is shown in the ElVis titlebar. It is usually 7654. The localName of your computer is also shown in the titlebar following the port number. The workDir is your desired working directory on the PPL file system.
Running RPLOT from ElVis assumes that your computer can make a socket connection to the PPL portal cluster. You must be logged in to your computer with your PPL account name. Here is a screenshot of a Windows computer running Cygwin/X. ElVis has been started from the xterm command line. A local command was entered to run rplot via ssh and connect to ElVis running on Windows:
1.3 ElVis in nx
Another approach is to run the nx client on your local computer and connect to the nx server on cportal.pppl.gov. This provides a graphical desktop on the PPL cluster. Now you can run ElVis on the cluster although the user interface will be slower than running ElVis directly on your local computer. Here is a screenshot of ElVis running within the nx client:
2. Running RPLOT Within ElVis -- A Web
Service