Chapter 16: Drawing graphs with Autograph
Previous chapter LLUs Home Next chapter Index
The Autograph utility allows you to draw X/Y plots of one or more curves on a labeled background. The appearance of an Autograph plot is controlled by a series of parameters that control characteristics such as line color and axis labels. These parameters are set and retrieved through user-callable entry points in Autograph, to which you supply the name of the parameter and the value to be assigned to it. For plots containing multiple curves, you may draw curves with user-selectable dash patterns and (or) colors.
The following modules show you how to use the Autograph utilities to draw and label your plots. Additionally, examples show how to use dash patterns and colors.
This module organizes Autograph routines by their functions.
- EZY
- Plots a complete graph of a single curve through the points (i,y(i)).
- EZXY
- Plots a complete graph of a single curve through the points (x(i),y(i)).
- EZMY
- Plots a complete graph of M curves through the points (i,y(i,1)), (i,y(i,2)), ... ,(i,y(i,M)). Additionally, EZMY can accept transposed y arrays if the appropriate parameters are set.
- EZMXY
- Plots a complete graph of M curves through the points (x(i),y(i,1)), (x(i),y(i,2)), ... , (x(i),y(i,M)). EZMXY is also capable of plotting (x(i,1),y(i,1)), ... , (x(i,M),y(i,M)), and EZMXY can accept transposed x and y arrays if the appropriate parameters are set.
- AGSTUP
- Initializes Autograph.
- AGBACK
- Draws the background (axes, labels, etc.) for an Autograph plot.
- AGCURV
- Draws the curves (one per call) for an Autograph plot.
- AGSETP
- Sets an array of parameters to Autograph.
- AGSETR
- Sets a single real parameter to Autograph.
- AGSETI
- Sets a single integer parameter to Autograph.
- AGSETC
- Sets a single character parameter to Autograph.
- AGGETP
- Retrieves an array of parameters to Autograph.
- AGGETR
- Retrieves a single real parameter to Autograph.
- AGGETI
- Retrieves a single integer parameter to Autograph.
- AGGETC
- Retrieves a single character parameter to Autograph.
- AGSAVE
- Saves Autograph's current state to a file.
- AGRSTR
- Restores Autograph's state from a file.
- AGCHAX
- Called by Autograph before and after drawing axes, tick marks, and axis numbering, AGCHAX can be replaced by a user-written routine to change intensities and colors for the next object to be drawn.
- AGCHCU
- Called by Autograph before and after drawing curves, AGCHCU can be replaced by a user-written routine to change intensities and colors for the next object to be drawn.
- AGCHIL
- Called by Autograph before and after drawing information labels, AGCHIL can be replaced by a user-written routine to change intensities and colors for the next object to be drawn.
- AGCHNL
- Called by Autograph before drawing each numeric label for the axes, AGCHNL can be replaced by a user-written routine to change the format or appearance of a numeric label.
- AGBNCH
- Converts binary dash patterns to character dash patterns.
- AGDSHN
- Generates the parameter names for the individual members of the dash pattern group to be passed to an AGSETC call for setting the dash patterns.
- AGUTOL
- Called by Autograph, AGUTOL controls the user-coordinate system to label-coordinate system mapping. AGUTOL can be replaced by a user-written routine to alter this mapping for any of the four (left, right, top, bottom) axes.
- AGPWRT
- Draws the numeric, axis, and informational labels. AGPWRT can be replaced by a user-written routine to alter the appearance of text strings on the plot.
EZY allows you to draw an X/Y plot of a single, one-dimensional array. EZY draws the background axes and plots a curve through the ordered pairs (i,y(i)). The plots drawn by EZY can be embellished by any of the techniques discussed later in this chapter.
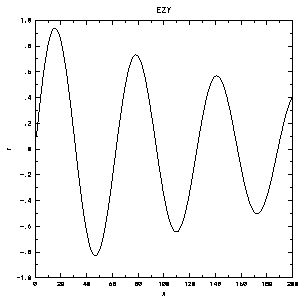
1       CALL OPNGKS
2       CALL EZY (YDRA,NPTS,'EZY$')
3       CALL CLSGKS
CALL EZY (YDRA,NPTS,TITLE)
- YDRA
- Real, Input---Array at least NPTS in length containing the Y-coordinate values to be plotted.
- NPTS
- Integer, Input---Contains the number of points to be plotted.
- TITLE
- Character, Input---Contains the title for the plot.
Line 1 of the fagezy.f code segment opens and initializes the GKS package. Line 2 passes the real array YDRA(NPTS) to EZY for plotting. The plot title will be 'EZY$'. Note the dollar sign ($) at the end of the title string, which behaves as a string terminator. A common mistake is to drop the dollar sign from the end of the title string. Line 3 closes GKS.
EZY is intended to be a simple interface to the Autograph package. It actually handles most of the details of producing a plot for you. EZY calls the following routines in this order:
- AGSTUP
- Autograph set up, which initializes the Autograph package and calls SET if necessary.
- AGBACK
- Autograph background, which draws the background for the plot, including axes and all labels.
- AGCURV
- Autograph curve, which draws the actual curve on the background.
- FRAME
- which terminates the current metacode plot frame and advances to the next plot frame.
It is possible to place multiple plots on a single frame. See the manual pages for the subroutine SET and the Autograph parameters SET and FRAME in the autograph_params man page.
EZXY allows you to draw an X/Y plot of ordered pairs. EZXY draws the background and axes and plots a curve through the ordered pairs (x(i),y(i)). The plots drawn by EZXY can be embellished by any of the techniques discussed later in this chapter.
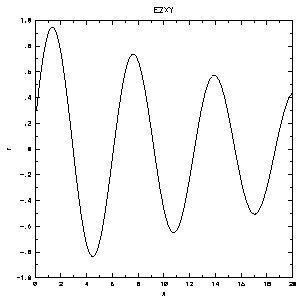
1       CALL OPNGKS
2       CALL EZXY (XDRA,YDRA,NPTS,'EZXY$')
3       CALL CLSGKS
CALL EZXY (XDRA,YDRA,NPTS,TITLE)
- XDRA
- Real, Input---A real array at least NPTS in length containing the X-coordinate values to be plotted.
- YDRA
- Real, Input---A real array at least NPTS in length containing the Y-coordinate values to be plotted.
- NPTS
- Integer, Input---Contains the number of points to be plotted.
- TITLE
- Character, Input---Contains the title for the plot.
Line 1 of the fagezy.f code segment opens and initializes the GKS package. Line 2 passes the real arrays YDRA(NPTS) and XDRA(NPTS) to EZXY for plotting. The plot title will be 'EZXY$'. Note the dollar sign ($) at the end of the title string which behaves as a string terminator. A common mistake is to drop the dollar sign from the end of the title string. Line 3 closes GKS.
EZXY is intended to be a simple interface to the Autograph package. It actually handles most of the details of producing a plot for you. EZXY calls the following routines in this order:
- AGSTUP
- Autograph set up, which initializes the Autograph package and calls SET if necessary.
- AGBACK
- Autograph background, which draws the background for the plot, including axes and all labels.
- AGCURV
- Autograph curve, which draws the actual curve on the background.
- FRAME
- which terminates the current metacode plot frame and advances to the next plot frame.
It is possible to place multiple plots on a single frame. See the manual pages for the subroutine SET and the Autograph parameters SET and FRAME in the autograph_params man page.
EZMY allows you to draw an X/Y plot of a single, two-dimensional array in which one dimension represents the curve number and the other dimension represents the points along that curve. Thus EZMY draws a background axis and plots a curve through the ordered pairs (i,y(i,1)) for i=1 to NPNTS, another through the points (i,y(i,2) for i=1 to NPNTS, and so on for NCURVE curves. The plots drawn by EZMY can be embellished by any of the techniques discussed later in this chapter.
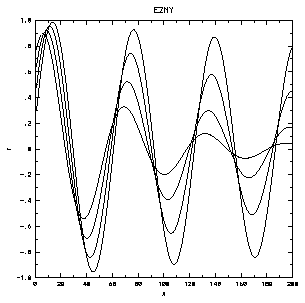
1       CALL OPNGKS
2       CALL EZMY (YDRA,NPTS,NCURVE,NPTS,'EZMY$'
3       CALL CLSGKS
CALL EZMY (YDRA, IMAX, NCURVE, NPTS, TITLE)
- YDRA
- Real, Input---A real array declared as YDRA(IMAX,NCURVE) which contains the Y-coordinate values to be plotted. The data in the plot are arranged (by default) such that the second index refers to the curve number and the first index refers to a point along a curve.
- IMAX
- Integer, Input---The maximum value of the first dimension of YDRA.
- NCURVE
- Integer, Input---The number of curves to be drawn. This number should be less than or equal to the maximum value of the second dimension (by default) of YDRA.
- NPTS
- Integer, Input---Contains the number of points to be plotted on each curve.
- TITLE
- Character, Input---Contains the Title for the plot.
Line 1 of the fagezmy.f code segment opens and initializes the GKS package. Line 2 passes the real array YDRA(IMAX,NCURVE) to EZMY for plotting. The plot title will be 'EZMY$'. Note the dollar sign ($) at the end of the title string, which behaves as a string terminator. A common mistake is to drop the dollar sign from the end of the title string. Line 3 closes GKS.
EZMY is intended to be a simple interface to the Autograph package. It actually handles most of the details of producing a plot for you. EZMY calls the following routines in this order:
- AGSTUP
- Autograph set up, which initializes the Autograph package and calls SET if necessary.
- AGBACK
- Autograph background, which draws the background for the plot, including axes and all labels.
- AGCURV
- Autograph curve, which draws the actual curves on the background. AGCURV is called NCURVE times: once for each curve.
- FRAME
- which terminates the current metacode plot frame and advances to the next plot frame.
If the array is transposed from what Autograph expects, you can use the following call to set a parameter to inform Autograph of this.
CALL AGSETI('ROW.',-1)
This call would be placed between the calls to OPNGKS and EZMY. After this parameter has been set, Autograph will expect the input arrays to a multicurve plot to look like YDRA(NCURVE,NPTS). To return Autograph to the default behavior (expecting YDRA(NPTS,NCURVE) set ROW back to a positive value.
CALL AGSETI('ROW.',1)
Common mistakes with the AGSETx calls are to forget the period (.) after the parameter name or to forget to enclose the parameter name in quotation marks (').
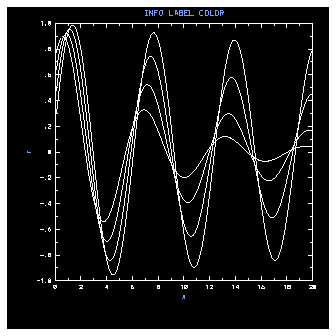
EZMXY allows you to draw an X/Y plot of a two- dimensional array containing the Y-coordinates to be plotted and a one-dimensional array containing the corresponding X-coordinates. For the two-dimensional array, one dimension represents the curve number, and the other dimension represents the points along that curve. (Optionally, the Autograph parameter ROW can be set to allow a two-dimensional X-coordinate array.) Thus EZMXY draws a background axis and plots a curve through the ordered pairs (x(i),y(i,1)) for i=1 to NPNTS, another through the points (x(i),y(i,2) for i=1 to NPNTS, and so on for NCURVE curves. The plots drawn by EZMXY can be embellished by any of the techniques discussed later in this chapter.

1       CALL OPNGKS
2       CALL EZMXY (XDRA,YDRA,NPTS,NCURVE,NPTS,'EZMXY$')
3       CALL CLSGKS
CALL EZMXY (XDRA, YDRA, IMAX, NCURVE,NPTS, TITLE)
- XDRA
- Real, Input---A real array at least NPTS in length containing the X-coordinate values of the ordered pairs to be plotted.
- YDRA
- Real, Input---A real array declared as YDRA(IMAX,NCURVE) that contains the Y-coordinate values of the ordered pairs to be plotted. The data in the plot are arranged (by default) such that the second index refers to the curve number and the first index refers to a point along a curve.
- IMAX
- Integer, Input---The maximum value of the first dimension of YDRA.
- NCURVE
- Integer, Input---The number of curves to be drawn. This number should be less than or equal to the maximum value of the second dimension (by default) of YDRA.
- NPTS
- Integer, Input---Contains the number of points to be plotted on each curve.
- TITLE
- Character, Input---Contains the title for the plot.
The first line of the code segment opens and initializes the GKS package. The second line passes the real array YDRA(IMAX,NCURVE) to EZMXY for plotting. The plot title will be 'EZMXY$'. Note the dollar sign ($) at the end of the title string, which behaves as a string terminator. A common mistake is to drop the dollar sign from the end of the title string. The last line of the Fortran segment closes GKS.
EZMXY is intended to be a simple interface to the Autograph package. It actually handles several of the details of producing a plot for you. EZMXY calls the following routines in this order:
- AGSTUP
- Autograph set up, which initializes the Autograph package and calls SET if necessary.
- AGBACK
- Autograph background, which draws the background for the plot, including axes and all labels.
- AGCURV
- Autograph curve, which draws the actual curves on the background. AGCURV is called NCURVE times: once for each curve.
- FRAME
- which terminates the current metacode plot frame and advances to the next plot frame.
If the YDRA array is transposed from what Autograph expects, you can use the following call to set a parameter to inform Autograph of this.
CALL AGSETI('ROW.',-1)
This call would be placed between the calls to OPNGKS and EZMXY. After this parameter has been set, Autograph will expect the input arrays to a multicurve plot to look like YDRA(NCURVE,NPTS). To return Autograph to the default behavior (expecting YDRA(NPTS,NCURVE), set ROW back to a positive value.
CALL AGSETI('ROW.',1)
Common mistakes with the AGSETx calls are to forget the period (.) after the parameter name or to forget to enclose the parameter name in quotation marks (').
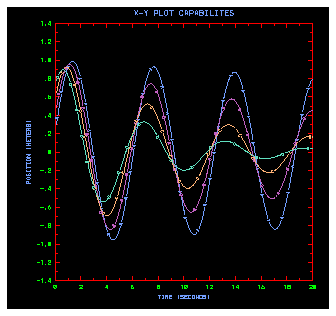
You may change an axis text label on a plot by setting three parameters (two character parameters and one integer parameter) before an EZ-routine is called (or more specifically, before AGBACK is called). The parameters should be set in order to avoid unexpected results.
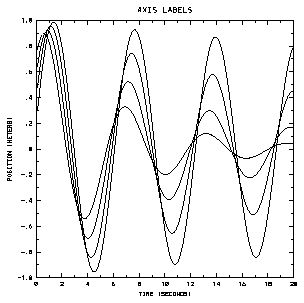
1 C     CHANGE BOTTOM (B) AXIS LABEL
2       CALL AGSETC('LABEL/NAME.','B')
3       CALL AGSETI('LINE/NUMBER.',-100)
4       CALL AGSETC('LINE/TEXT.','TIME (SECONDS)$')
5 C     CHANGE LEFT (L) AXIS LABEL
6       CALL AGSETC('LABEL/NAME.','L')
7       CALL AGSETI('LINE/NUMBER.',100)
8       CALL AGSETC('LINE/TEXT.','POSITION (METERS)$')
9       CALL EZMXY (XDRA,YDRA,NPTS,NCURVE,NPTS,'AXIS TEXT LABELS$')
      CALL AGSETC ('LABEL/NAME.', cval)
      CALL AGSETI ('LINE/NUMBER.', ival)
- LABEL/NAME
- Character---Works in conjunction with LINE/NUMBER to refer to the label to be changed. After they are set, LINE/TEXT can be set to alter the text of the label. The values of LABEL/NAME and LINE/NUMBER combine as follows to select a specific axis label.
-----------------------------
LABEL/NAME        LINE/NUMBER
-----------------------------
B---Bottom label   -100
L---Left label     100
R---Right label    -100
T---Top label      100
-----------------------------
Lines 2 and 3 of the fagaxlbl.f code segment specify that we are about to modify information about the text label on the bottom axis. Line 4 changes the contents of that label's text string. Lines 6, 7, and 8 make a similar change to the information buffer for the left axis text label.
The most common mistakes with setting axis labels are to either drop one of the parameter-setting calls or to confuse the order of the calls. This can produce unexpected results. Additionally as has been mentioned before, the parameter strings must be terminated with a period. Finally, the label text strings must be terminated with a dollar sign ($).
The minimum and maximum values on an axis can be changed with a group of three subroutine calls to set three Autograph parameters.
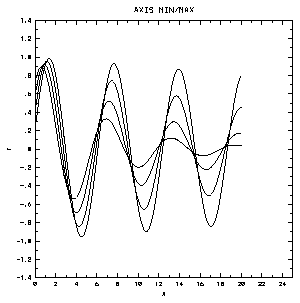
1       CALL AGSETR('Y/MINIMUM.',-1.4)
2       CALL AGSETR('Y/MAXIMUM.', 1.4)
3       CALL AGSETR('Y/NICE.',    0.0)
4
5       CALL AGSETR('X/MINIMUM.', 0.0)
6       CALL AGSETR('X/MAXIMUM.',25.0)
7       CALL AGSETR('X/NICE.',    0.0)
8
9       CALL EZMXY (XDRA,YDRA,NPTS,NCURVE,NPTS,'AXIS MIN/MAX$')
      CALL AGSETR ('X/MINIMUM.', rval)
      CALL AGSETR ('X/MAXIMUM.', rval)
      CALL AGSETR ('X/NICE.', rval)
- Y/MINIMUM
- Real---The minimum value for the plot's Y-axis.
- Y/MAXIMUM
- Real---The maximum value for the plot's Y-axis.
- Y/NICE
- Real---Flag to indicate to Autograph that the Y-axis minimum and maximum have already been set by the user and should not be changed. The value of this flag will dictate the appearance of the tick marks on the axis:
- -1.0
- Adjust to force major tick marks at the endpoints of the left axis. (Default)
- 0.0
- Do not adjust either vertical axis.
- +1.0
- Adjust to force major tick marks at the endpoints of the right axis.
- X/MINIMUM
- Real---The minimum value for the plot's X-axis.
- X/MAXIMUM
- Real---The maximum value for the plot's Y-axis.
- X/NICE
- Real---Flag to indicate to Autograph that the X-axis minimum and maximum have already been set by the user and should not be changed. The value of this flag will dictate the appearance of the tick marks on the axis:
- -1.0
- Adjust to force major tick marks at the endpoints of the bottom axis. (Default)
- 0.0
- Do not adjust either horizontal axis.
- +1.0
- Adjust to force major tick marks at the endpoints of the top axis.
In the fagaxmax.f code segment, we set the Y-axis minimum in line 1 and set the Y-axis maximum in line 2. In line 3, we set the Y/NICE flag to notify Autograph that we have set the minimum and maximum values for this plot and that Autograph should not attempt to rescale the Y-axis for the plot. Lines 5 through 7 accomplish the same on the X-axis.
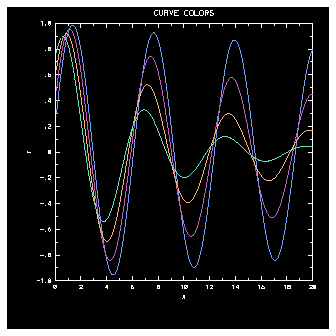
Sometimes we would like a simple method for differentiating multiple curves on one plot. The simplest way to do this is to mark each curve with a letter indicating the order in which the curves were drawn. More complex methods of marking the curves and creating your own dash patterns are also available.

1       CALL OPNGKS
2       CALL AGSETR('DASH/SELECTOR.',-1.0)
3       CALL EZMXY (XDRA,YDRA,NPTS,NCURVE,NPTS,'DASH PATTERNS$')
4       CALL CLSGKS
CALL AGSETR (PNAM, rval)
- PNAM
- Character, Input---Specifies which parameter is to be changed.
- DASH/SELECTOR
- Real---Selects DASH/SELECTOR as the parameter to be updated. DASH/SELECTOR controls the dash patterns used for drawing curves. The default is +1.0.
- -n
- Specifies that Autograph use the 26 built-in "alphabetic" dash patterns. If more than 26 curves are to be drawn, then the dash patterns for the curves are chosen round-robin fashion from this list of 26 dash patterns.
- +n
- A positive integral real number less than 26 specifies the use of the first n user-defined dash patterns. If more than n curves are to be drawn, then the dash patterns for the curves are chosen round-robin fashion from this list of n dash patterns. The default set of user-defined dash patterns produces all solid lines.
Line 2of the fagcudsh.f code segment sets the Autograph parameter DASH/SELECTOR to -1.0, telling Autograph to use the alphabetic dash patterns for drawing the curves. This is followed by a call to EZMXY, which draws a set of NCURVE curves (using the alphabetic dash patterns).
The most common mistake, as has been mentioned before, is to forget to terminate the parameter name string with a period. Also note that the parameter value type must match the AGSETx routine being used to set the parameter.
For more information on user-definable dash patterns, see the autograph_params man page for the parameters DASH, DASH/SELECTOR, DASH/LENGTH, DASH/CHARACTER, DASH/DOLLAR-QUOTE, DASH/PATTERNS/1 through DASH/PATTERNS/26, and the DASHD, AGDSHN, and AGCURV man pages.
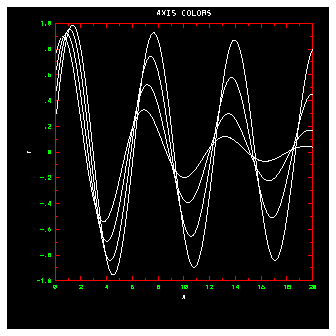
Autograph has several routines called before and after drawing various portions of a plot. One such routine is AGCHCU, which is called before and after drawing each curve. The default version of AGCHCU does nothing, but you can write your own version of this routine which changes the GKS polyline color index and the GKS text color index before drawing a line.
1       SUBROUTINE AGCHCU(IFLG,KDSH)
2       CALL PLOTIF (0.,0.,2)
3       IF (IFLG .EQ. 0) THEN
4          CALL GSPLCI( ABS(KDSH)+3 )
5          CALL GSTXCI( ABS(KDSH)+3 )
6       ELSE
7          CALL GSPLCI(1)
8          CALL GSTXCI(1)
9       ENDIF
10      RETURN
11      END
CALL AGCHCU (IFLG, KDSH)
- IFLG
- Integer, Input---Indicates whether this call is occurring before or after the object is drawn. If IFLG is 0, Autograph is about to draw a curve. If IFLG is nonzero, Autograph has just finished drawing a curve.
- KDSH
- Integer, Input---Indicates the curve number/dash pattern being used to draw this curve. The curve number will be the absolute value of KDSH. KDSH will be negative if the alphabetic dash patterns are being used and positive if the default or user-definable dash patterns are being used.
Line 2 of the fagcuclr.f calls the SPPS routine PLOTIF to move the "pen" to the origin in the "pen-up" position. This has the effect of flushing the SPPS polyline buffer so that any changes we make actually show up in the plot. Lines 3, 6, and 9 contain an IF construct that tests whether AGCHCU is being called before or after a curve has been drawn.
Lines 4 and 5 are executed before a curve is drawn. Line 4 sets the GKS polyline color index according to which curve is being drawn, indicated by KDSH, and line 5 sets the GKS text color index to the same value to handle cases in which the alphabetic dash patterns are used. Lines 7 and 8 are executed after a line has been drawn and serve to reset the GKS polyline and text color indices to the foreground color.
There are three common errors in setting colors. The first is to forget to set both the polyline and text colors back to the foreground color after drawing an object. The second common error results from trying to use GSCR to change the foreground color within AGCHCU. And last, if you forget to call PLOTIF before changing the color indices, GKS calls made while there is data in the SPPS polyline buffer will not have the desired effect.
Autograph has several routines called before and after drawing various portions of a plot. One such routine is AGCHAX, which is called before and after drawing each axis object. The default version of AGCHAX does nothing, but you can write your own version of this routine which changes the GKS polyline color index and the GKS text color index before drawing a line.
Your modified version of AGCHCU must be loaded before the NCAR Graphics libraries are loaded; otherwise, the default AGCHCU will be used.
1       SUBROUTINE AGCHAX(IFLG,IAXS,IPRT,VILS)
2       CALL PLOTIF (0.,0.,2)
3       IF (IFLG .EQ. 0) THEN
4          CALL GSPLCI(3)
5          CALL GSTXCI(2)
6       ELSE
7          CALL GSPLCI(1)
8          CALL GSTXCI(1)
9       ENDIF
10      RETURN
11      END
CALL AGCHAX (IFLG, IAXS, IPRT, VILS)
- IFLG
- Integer, Input---Indicates whether this call is occurring before or after the object is drawn. If IFLG is 0, Autograph is about to draw a curve. If IFLG is nonzero, Autograph has just finished drawing a curve.
- IAXS
- Integer, Input---Indicates which axis is being drawn.
- 1
- Left axis
- 2
- Right axis
- 3
- Bottom axis
- 4
- Top axis
- IPRT
- Integer, Input---Indicates which part of the axis is being drawn.
- 1
- The axis line
- 2
- A major tick mark
- 3
- A minor tick mark
- 4
- The mantissa of a numeric label
- 5
- The exponent of a numeric label
- VILS
- Real, Input---Indicates the point in the label system at which the object is being drawn.
Line 2 of the fagaxclr.f code segment calls the SPPS routine PLOTIF to move the "pen" to the origin in the "pen-up" position. This has the effect of flushing the SPPS polyline buffer so that any changes we make actually show up in the plot. Lines 3, 6, and 9 contain an IF construct that tests whether AGCHAX is being called before or after an object has been drawn. Lines 4 and 5 are executed before an object is drawn. Line 4 sets the GKS polyline color index, and line 5 sets the GKS text color index. Lines 7 and 8 are executed after an object has been drawn and serve to reset the GKS polyline and text color indices to the foreground color.
There are three common errors in setting colors. The first is to forget to set both the polyline and text colors back to the foreground color after drawing an object. The second common error results from trying to use GSCR to change the foreground color within AGCHAX. And last, if you forget to call PLOTIF before changing the color indices, GKS calls made while there is data in the SPPS polyline buffer will not have the desired effect.
Your modified version of AGCHAX must be loaded before the NCAR Graphics libraries; otherwise, the default AGCHAX will be used.
Autograph has several routines called before and after drawing various portions of a plot. One such routine is AGCHIL, which is called before and after drawing each informational label. The default version of AGCHIL does nothing, but you can write your own version of this routine that changes the GKS polyline color index and the GKS text color index before drawing a label.
1       SUBROUTINE AGCHIL(IFLG,LBNM,LNNO)
2       CALL PLOTIF (0.,0.,2)
3       IF (IFLG .EQ. 0) THEN
4          CALL GSTXCI(4)
5       ELSE
6          CALL GSTXCI(1)
7       ENDIF
8       RETURN
9       END
CALL AGCHIL (IFLG, LBNM, LNNO)
- IFLG
- Integer, Input---Indicates whether this call is occurring before or after the object is drawn. If IFLG is 0, Autograph is about to draw a curve. If IFLG is nonzero, Autograph has just finished drawing a curve.
- LBNM
- Character, Input---Indicates the name of the label being drawn.
- LNNO
- Integer, Input---Indicates the number of the label being drawn.
Line 2 of the fagilclr.f code segment calls the SPPS routine PLOTIF to move the "pen" to the origin in the "pen-up" position. This has the effect of flushing the SPPS polyline buffer so that any changes we make actually show up in the plot. Lines 3, 5, and 7 contain an IF construct that tests whether AGCHIL is being called before or after a label has been drawn. Line 4 is executed before a label is drawn; it sets the GKS text color index. Line 6 is executed after a label has been drawn and serves to reset the GKS text color index to the foreground color.
There are three common errors in setting colors. The first is to forget to set the text color back to the foreground color after drawing an object. The second common error results from trying to use GSCR to change the foreground color within AGCHIL. And last, if you forget to call PLOTIF before changing the color indices, GKS calls made while there is data in the SPPS polyline buffer will not have the desired effect.
Your modified version of AGCHIL must be loaded before the NCAR Graphics libraries; otherwise, the default AGCHIL will be used.
Previous chapter LLUs Home Next chapter Index