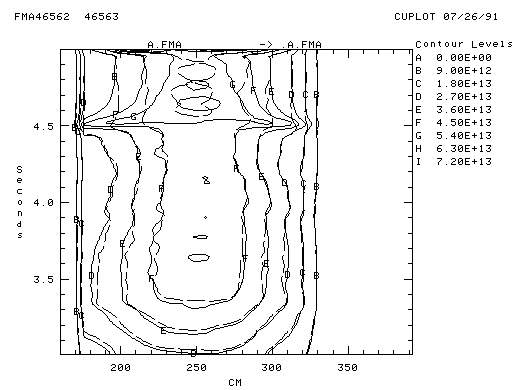
SH 46562 S2 46563The contour lines, and associated fill areas, use the color sequence set by the ``O K'' (Option Kolor) command. The first area (space outside the first contour level) is not filled; thus it appears white.DE [FM]A.FMA ; !2D ufile
R
XT 3 5
PC
Figure 4: Contour plot of MIRI density for two shots
O CNumber of contours[8]? ,
Number of colors[0]? ,
Shade between lines[N]? ,
Label contour levels[Y]? ,
IR buffer size (0=default=1000)[0]? ,
PL buffer size (0=default=2000)[0]? ,
AREA buffer size (0=default=80000)[0]? ,
The contour fill routine needs three temporary buffers. The size of the IR buffer is proportional to the length of the longest single contour line; the size of the PL buffer to the length of the longest line enclosing an area to be filled; the size of the AREA buffer, to the total number of enclosed areas. The defaults for these buffers, indicated by the ``default=nnn'' in the prompt, are adequate for most reasonable data. If any buffer is not big enough, the plot will abort with a message such as ``PL buffer overflow'' at the bottom of the plot page. In this case increase the size of that buffer and try again.
