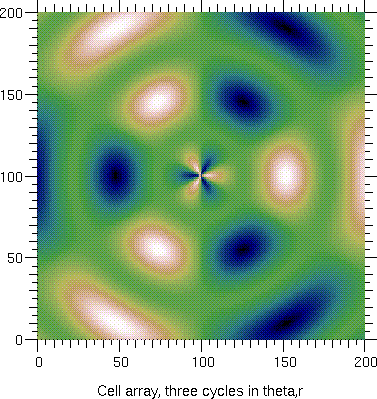
Another (and more interesting) example of a CellArray is given below. First we show the functions mag and a3, which are used to calculate the data plotted.
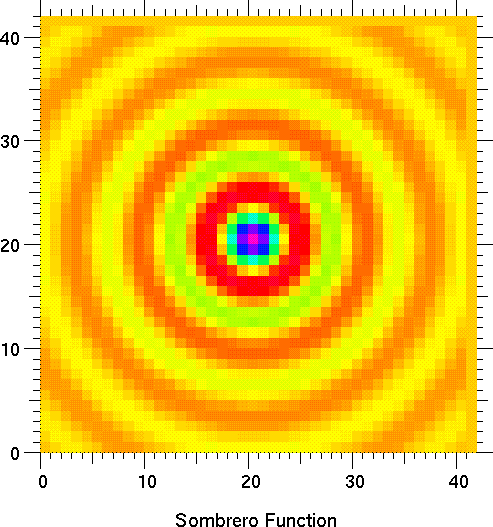
A final example of the CellArray is the sombrero function.
Currently, CellArray objects are only available in PyGist.
A CellArray is a regular two dimensional rectangular mesh whose cells are color filled as specified by the keyword argument z. The keywords accepted by CellArray are:
In addition, CellArray objects have the methods new and set, like all other 2d geometric objects.
The following keyword arguments can be specified for CellArrays:
z = <2d sequence of numeric or unsigned character values>
specifies the coloring to be given to the CellArray. If numeric, the values are interpolated onto a palette. If unsigned character, the values are used to index into the palette. The argument z is required. If the dimensions of z are n1 and n2, then the cell array will be n1 by n2 cells in size.
x0, y0 -- floating point scalars; if present, the coordinates of the lower left corner of the cell array. The default is (0., 0.).
These coordinates are optional, but if they are present then x1, y1 must be also (see below).
x1, y1 -- floating point scalars; if present, the coordinates of the upper right corner of the cell array. If these optional keywords are missing, then x0, y0 must be also missing, and their default values (1.0, 1.0) will be used.
hide = 0/1 (1 to hide this part of the graph)
label = <string> label for this part of the graph.
Methods new and set are as in the other 2d classes.
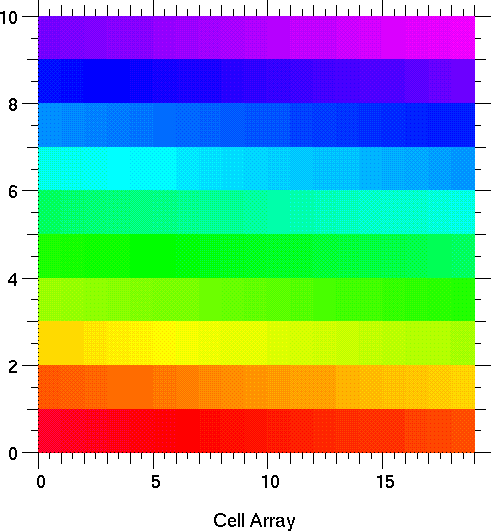
The following simple example creates a 10 by 19 CellArray object and plots it.
Another (and more interesting) example of a CellArray is given below. First we show the functions mag and a3, which are used to calculate the data plotted.
A final example of the CellArray is the sombrero function.