[Top] [Prev] [Next] [Bottom]
5.1 Graph2d Objects
Instantiation
- from graph2d import *
- g2 = Graph2d ( <object list>, <keylist>)
Description
A Graph2d is a two-dimensional graphics object which contains one or more 2d geometric objects plus a global environment. It will accept one or a list of Plotter objects or plotter identifiers, or will try to complete generic connection(s) of its own if asked to plot without having been given a plotter specification.
<object list> is one or a sequence of 2d geometric objects. It makes sense sometimes to graph several Curve objects on one plot; the user can specify several 2d objects of other types, or even of mixed types, but does so at his/her own risk.
A list of keyword arguments accepted by Graph2d is:
- plotter, filename, display, graphics, style, label_type, titles, title_colors, grid_type, axis_labels, x_axis_label, y_axis_label, yr_axis_label, axis_limits, x_axis_limits, y_axis_limits, yr_axis_limits, axis_scales, x_axis_scale, y_axis_scale, yr_axis_scale, text, text_color, text_size, text_pos, color_card, xyequal, sync, color_bar, color_bar_pos
There are a number of methods available in Graph2d to enable the user to reconfigure an existing object. Let's say that g2 is a Graph2d object.
g2.new ( <object list>, <keylist>): has the same arguments as Graph2d, and simply reinitializes an existing Graph2d object, instead of instantiating a separate one.
g2.add ( <2d object>) adds the specified 2d object to the others already in the Graph2d. (2d objects are numbered in the order that they are put into the graph, beginning with 1.)
g2.delete (n): deletes the nth 2d object from the Graph2d.
g2.replace (n, <2d object>): replaces the nth 2d object in the Graph2d with the one specified.
g2.change_plot ( <keyword arguments>): used to change any Graph2d characteristics except the 2d objects being graphed. Use the add, delete, and/or replace methods to do that. change_plot will draw the graph without sending object coordinates, unless keyword send is 1. Generally, change_plot should be used when the graph needs to be recomputed, and quick_plot (below) when it does not. change_plot does no error checking and does not convert user-friendly names of colors and such into numbers.
g2.quick_plot ( <keyword arguments>) is used to change some Graph2d characteristics which do not demand that the graph be recomputed. You can change the characteristics of a 2d object in the graph by specifying its number (curve = n) and any combination of the traits type, color, and label. Or you can change such overall graph characteristics as label_type, titles, title_colors, text, text_color, text_size, text_pos, color_card, grid_type, sync, and axis_labels. The changes will be effected and the graph redrawn.
Things that you cannot change include axis limits and scales, and the coordinates of a curve. Use change_plot if axis limits and scales are among the things you want to change, and use add, delete, or replace followed by a call to plot, if you wish to change the 2d object list.
g2.plot ( ) plots a 2d graph. If the user has not by now specified Plotter(s) or filename(s) then a generic Plotter object will be created, if it is possible to find a local Graphics routine.
Graph2d objects inherit from base class Graph, as does Graph3d. The following methods are inherited from Graph:
g2.add_file ("filename") allows the user to add a Plotter contacted via "filename" to the list of Plotters being used to draw the current Graph object.
filename has different (and incompatible) meanings for PyNarcisse and PyGist, because the two graphics packages are so fundamentally different in the way that the user program communicates with them. Please consult the discussion of keyword arguments in the following section.
g2.delete_file ("filename") allows the user to delete a Plotter contacted via "filename" from the list of Plotters being used by this object.
g2.add_display ("host") and g1.delete_display ("host") adds or deletes a Plotter displaying on the specified host. Currently, these are the same as the add_file and delete_file for PyGist.
g2.add_plotter (pl) allows the user to add the specified Plotter to the list of Plotters being used by this object.
g2.delete_plotter (pl) allows the user to delete the specified Plotter from the list of Plotters being used by this object.
g2.change ( <keyword arguments>) allows some of the graph's generic characteristics to be changed. These are sync, titles, title_colors, style (PyGist only), grid_type, axis_labels (and x_axis_labels, etc.), axis_limits (and x_axis_limits, etc.), axis_scales (and x_axis_scales, etc.), text, text_color, text_size, and text_pos.
Keyword Arguments
This section describes the Graph2d keyword arguments. The first three keywords are used to identify where and how you want the graph plotted. A Graph2d will create a default plotter if none of these keywords is specified; see below.
plotter = <Plotter object> or a sequence of <Plotter object>s if you have a Plotter object or a sequence of them that you want the Graph2d to use when plotting itself. In particular, if you want to plot only to CGM or PostScript files and not interactively (i. e., in batch mode), then you will need to instantiate your own Plotter and give it to the Graph2d object. Currently Graph objects cannot instantiate their own batch Plotters, although this feature will eventually be added.
filename = <string> or a sequence of <string>s specifies plotting associated with a particular filename. PyGist and PyNarcisse differ dramatically in the meaning of this keyword, as explained below.
PyGist: currently, filename is synonymous with the display keyword, which specifies a host where the PyGist window is to be displayed. If the user wants a plotter which plots to a given CGM or PostScript file (or one of each), then the user must instantiate one or more Plotter objects and hand them to the Graph2d via the plotter keyword. Eventually this will be changed to make it easier on the user. But for future compatibility, use the display keyword to specify where PyGist will open its window, and instantiate a Plotter yourself if you wish to have PyGist send plots to a file. (See "Plotters: A Brief Primer" on page 107.)
PyNarcisse: filename can be used in two different ways.
(1) As a way to specify a Narcisse process to connect to. In this case, the filename should be in the form "machine+port_serveur++user@ie.32" where machine specifies where the display is to take place (e. g., "icf.llnl.gov:0.0"), port_serveur is the port number displayed on the Narcisse GUI, and user is the userid of the person running.
(2) As a filename where Narcisse is to dump its plots. In this case, use the file suffix ".spx" to specify a binary file, or ".spc" for an ascii dump file. If a filename of this form is specified, PyNarcisse attempts a connection to Narcisse using the value of the DEST_SP3 environment variable, if it exists, and if not, attempts to construct a connection filename using DISPLAY environment variable for machine, the value of the PORT_SERVEUR environment variable (or the default 2101 if PORT_SERVEUR is not defined) for port_serveur, and the value of USER for user.
display = <string> or a sequence of <string>s if you want to display on the named hosts. (This keyword is ignored by PyNarcisse, since the desired display is specified in the filename keyword.) The form of <string> is the usual
- "hostname:server.screen"
The purpose of this argument is to allow you to continue without exiting Python if you have to open a Gist window without the DISPLAY environment variable having been set, or if you want to open Gist windows on more than one host.
If none of the above three keywords is specified, then when asked to plot, a Graph2d will attempt to connect to a plotter as follows:
Examples
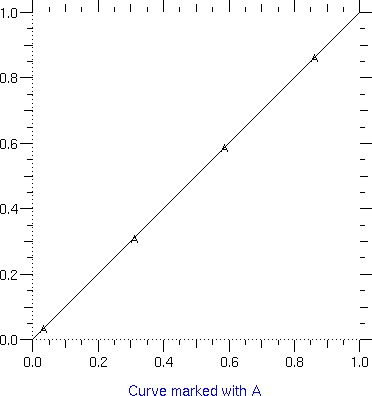
The following sequence of instructions creates a simple curve (a straight line), a 75 dpi plot window, passes both objects to a new Graph2d object with a blue title, and does the plot:
- c1 = Curve ( y = [0,1] , marks = 1 , marker = "A" )
- pl = Plotter ( dpi = 75 )
- g1 = Graph2d ( c1, plotter = pl , titles =
- "Curve marked with A" , title_colors = "blue")
- g1.plot ()
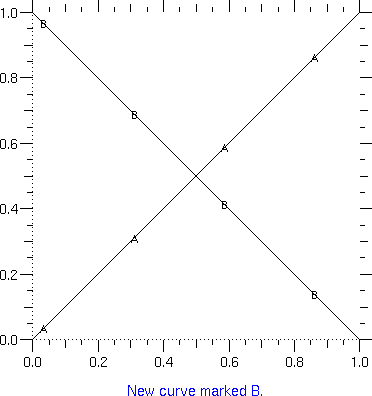
This next sequence adds a second curve to the above Graph2d, and changes the title:
- c2 = Curve ( y = [1,0] , marks = 1 , marker = "B")
- g1.add (c2)
- g1.change (titles = "New curve marked B.")
- g1.plot ()
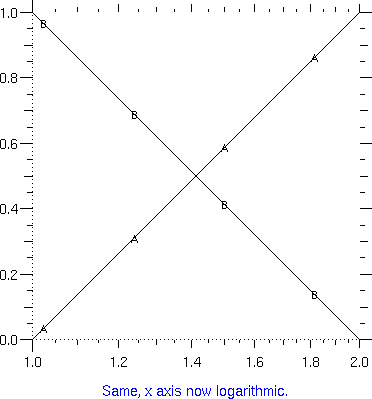
Now we set the x coordinates of the two curves. g1 has already been given references to c1 and c2, so the changes will be visible to g1 and will be reflected in the new plot. g1's title is changed, and the x scale is changed to logarithmic.
- c1.set ( x = [1,2] )
- c2.set ( x = [1,2] )
- g1.change (axis_scales = "loglin",
- titles = "Same, x axis now logarithmic.")
- g1.plot ( )
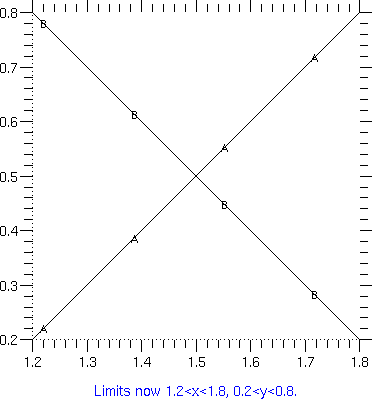
Change the x axis scale back to linear, and change the axis limits to show only a part of the graph:
- g1.change (x_axis_scale = "lin",
- axis_limits=[[1.2,1.8],[0.2,0.8]],
- titles="Limits now 1.2<x<1.8, 0.2<y<0.8.")
- g1.plot ()
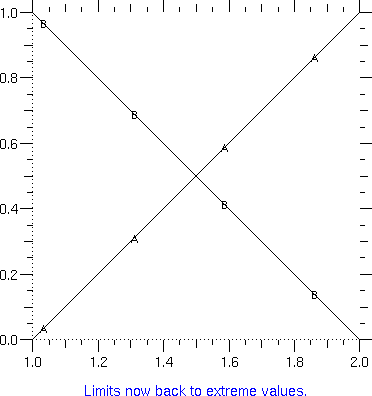
Change the axis limits back to defaults, i. e., values computed from the data by PyGist:
- g1.change(axis_limits="defaults",
- titles="Limits now back to extreme values.")
- g1.plot ()
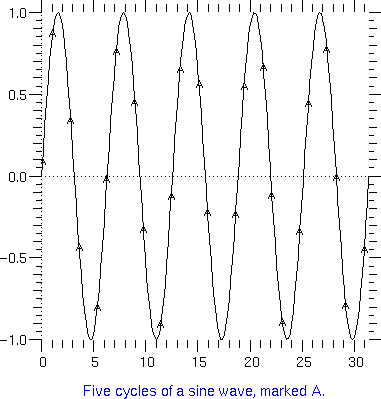
The next example shows how you can change the curve or curves associated with a Graph2d object. Here we delete the two curves associated with g1, then add the new one, change the title, and plot.
- x=10*pi*arange(200, typecode = Float)/199.0
- c1 = Curve ( x = x , y = sin(x),marks = 1, marker= "A")
- g1.delete (2)
- g1.delete (1)
- g1.add (c1)
- g1.change (titles = "Five cycles of a sine wave, marked A.")
- g1.plot ( )
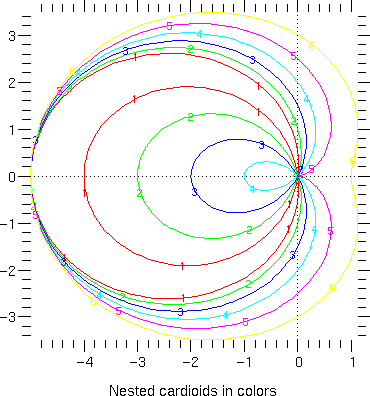
The next sequence of code creates a list of Curve objects which are nested cardioids with different parameters. It then creates a new Graph2d containing these Curves, and plots them in different colors, labeling each with a number.
- x=2*pi*arange(200, typecode = Float)/199.0
- crvs = []
- for i in range (1,7) :
- r = 0.5*i -(5-0.5*i)*cos(x)
- s = \Qi\Q
- crvs.append(Curve(y=r*sin(x),x=r*cos(x),marks=0,
- color=-4-i,label=s))
- g1=Graph2d(crvs,plotter = pl,
- titles="Nested cardioids in colors")
- g1.plot ( )
[Top] [Prev] [Next] [Bottom]
support@icf.llnl.gov
Copyright © 1997,Regents of the University of California. All rights
reserved.


