VisIt for M3DC1
1. Run VisIt
Version 2.4.0 of VisIt is on the PPL file system in
/p/vis/visit/new/visit2.4.0.
To run this version, log in to portal, e.g.:
ssh -X portal
1.1 Get the parallel rendering
config file
In your home directory, make the directory .visit/hosts if it is not
already there.
cd .visit/hosts
cp /u/efeibush/.visit/hosts/host_visit2_4_0.xml .
module purge
module load ppplcluster/1.1
module load pathscale/3.2
/p/vis/visit/new/visit2.4.0/src/bin/visit
This brings up the graphical user interface and
display window.
2. Load Data File
Large data files stored on the cluster are handled with parallel
rendering.
File --> Open file ...
In the File open dialog box:
Change Host from localhost to visit2.4.0
Change Open file as type: M3DC1
Navigate to a directory and select a data file,
such as /p/vis/m3d/data2/C1.h5
Click on OK.
This will bring up a dialog
box for setting the number of processors. You can increase it
to 8 but that could delay the start of the batch rendering
job. Click on OK.
This will bring up an info box
showing compute engine launch progress. The box will go away
when the file reading is complete. The example file is 60 GB
and takes about 3 minutes to read in.
At the command line it will
print the batch job number of the parallel rendering process.
You can check this using qstat to see if the batch job for the
parallel rendering is running.
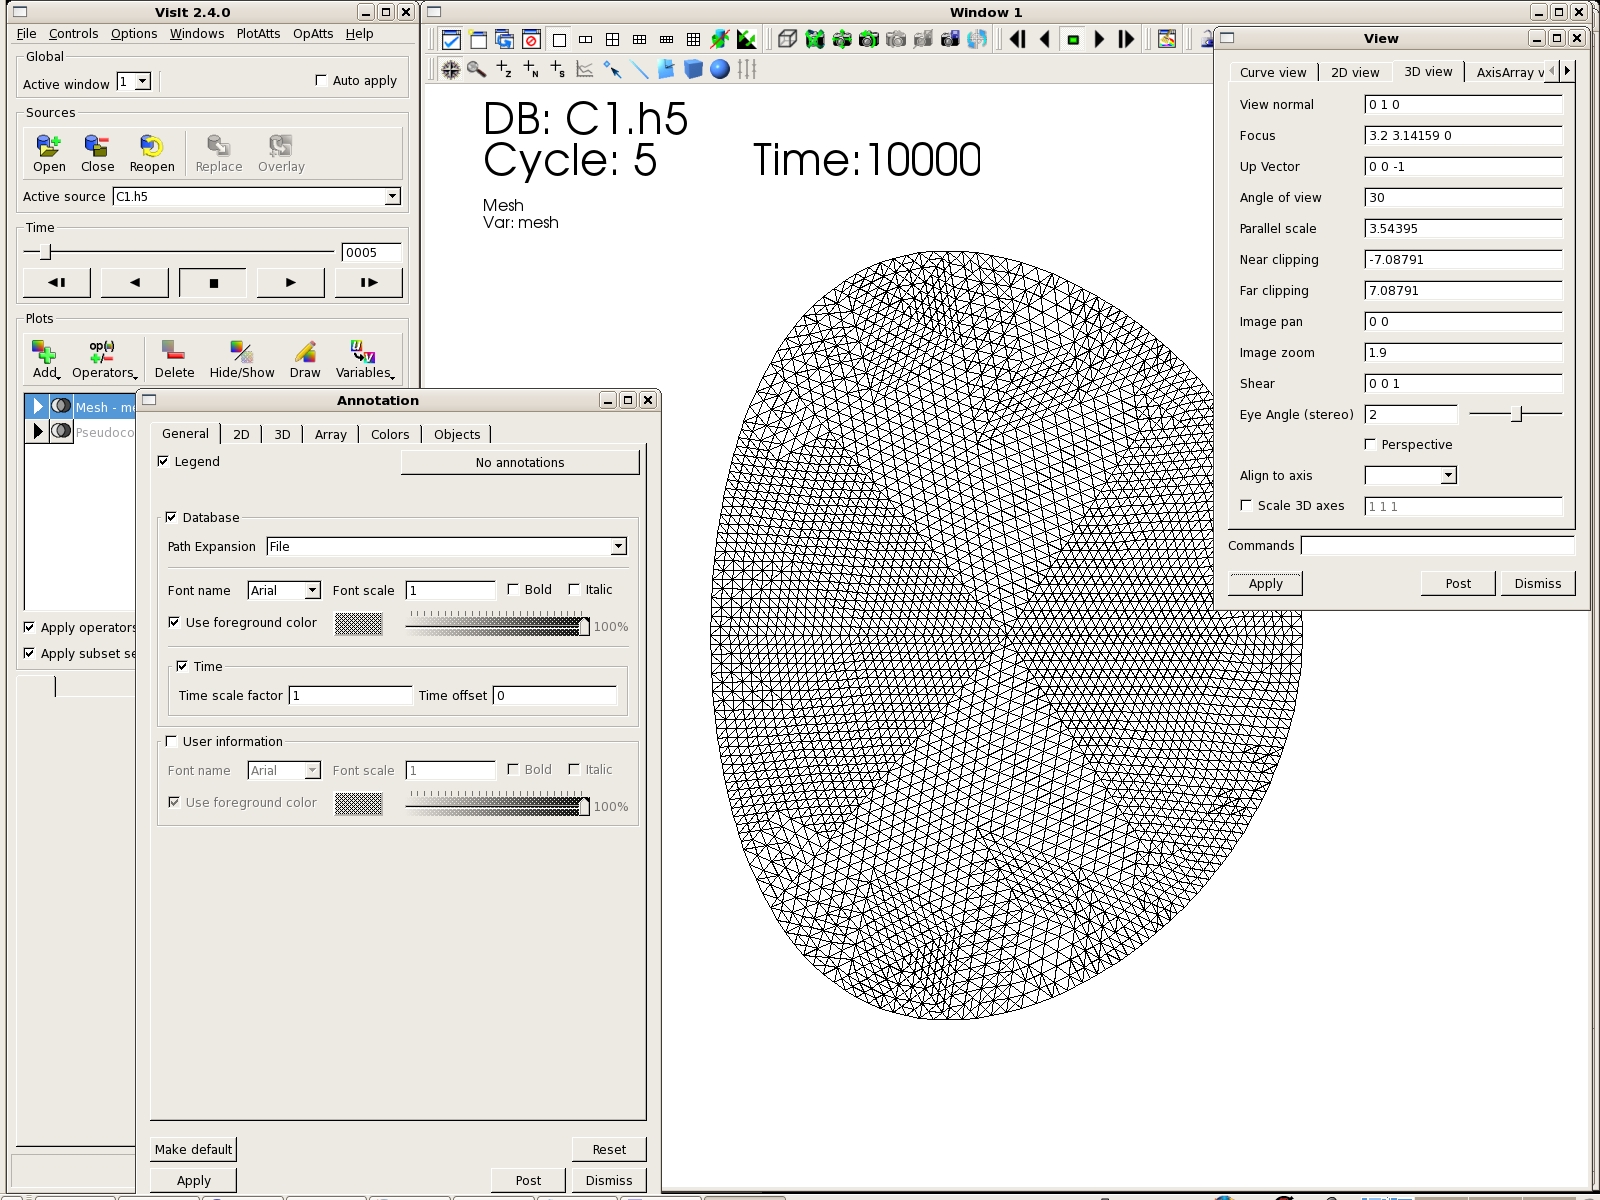
3. Select Plots
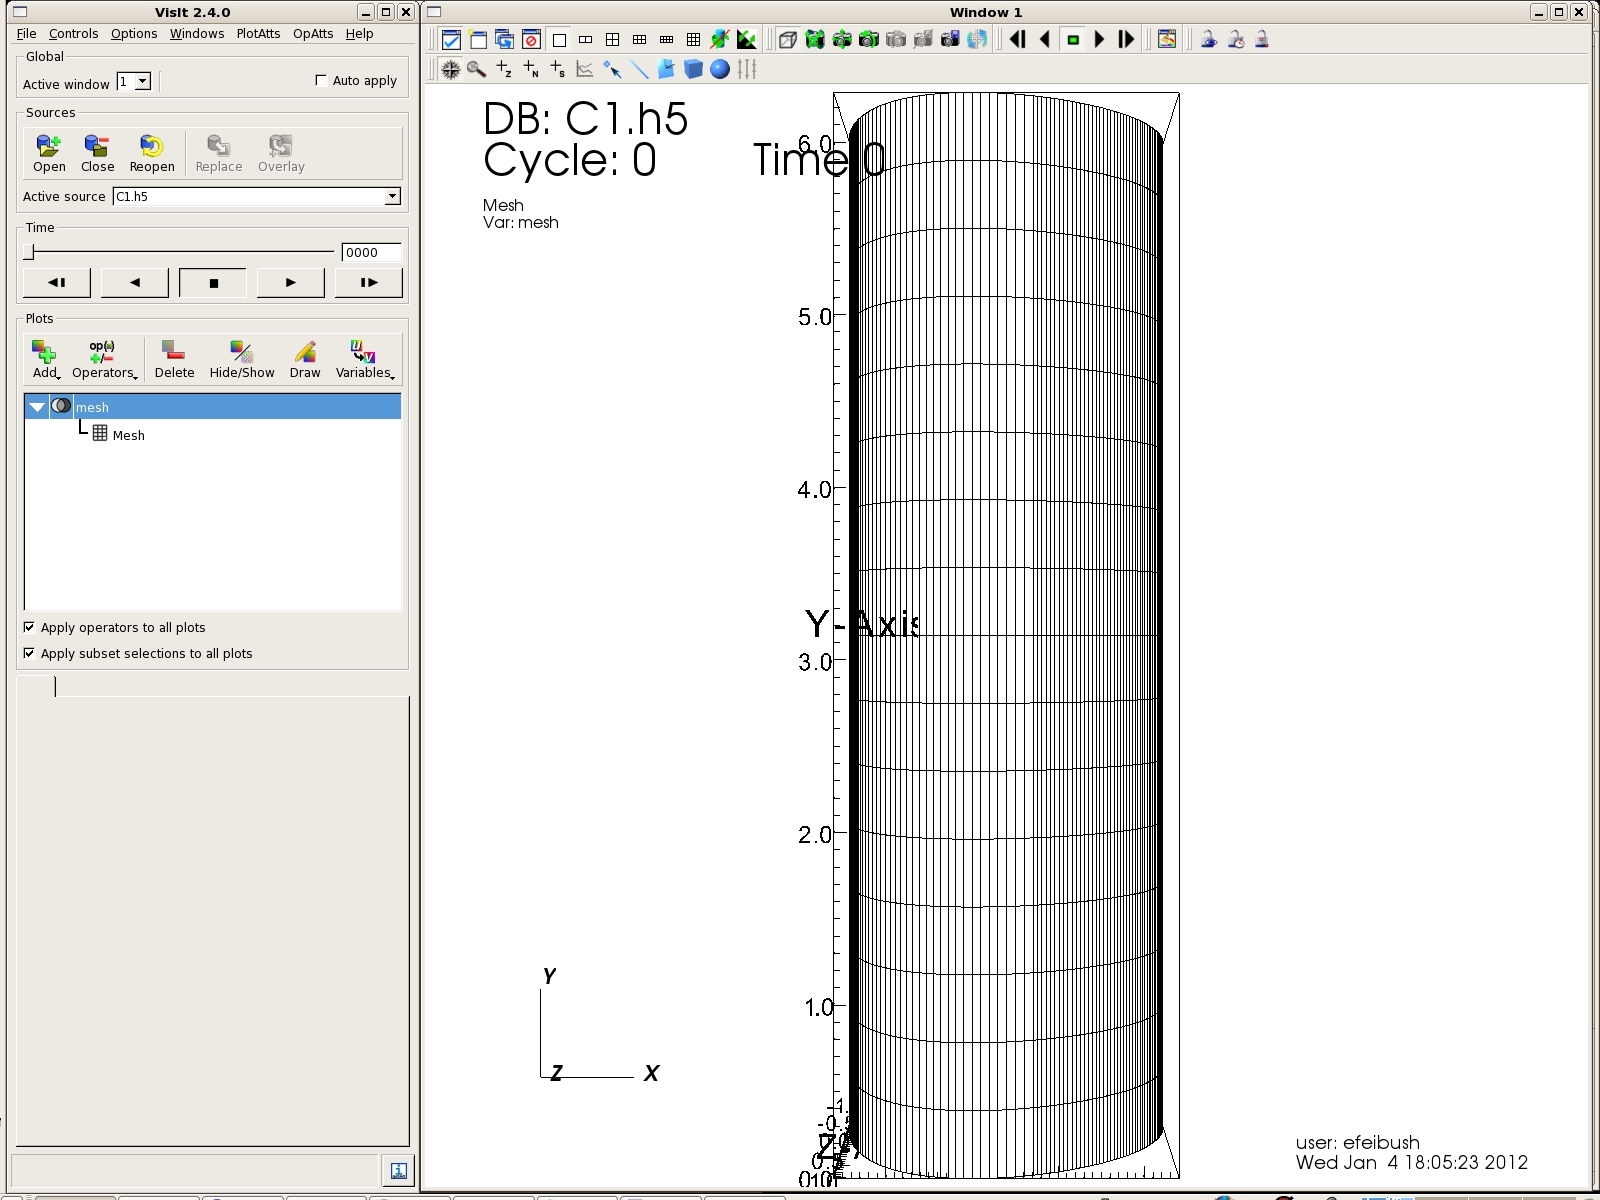
In the GUI, go to Add-->Mesh
Mesh - mesh will be shown in the drawing list
area.
Click on Draw. This may take a while.
Some messages will be shown in the status area at the bottom of the
GUI.
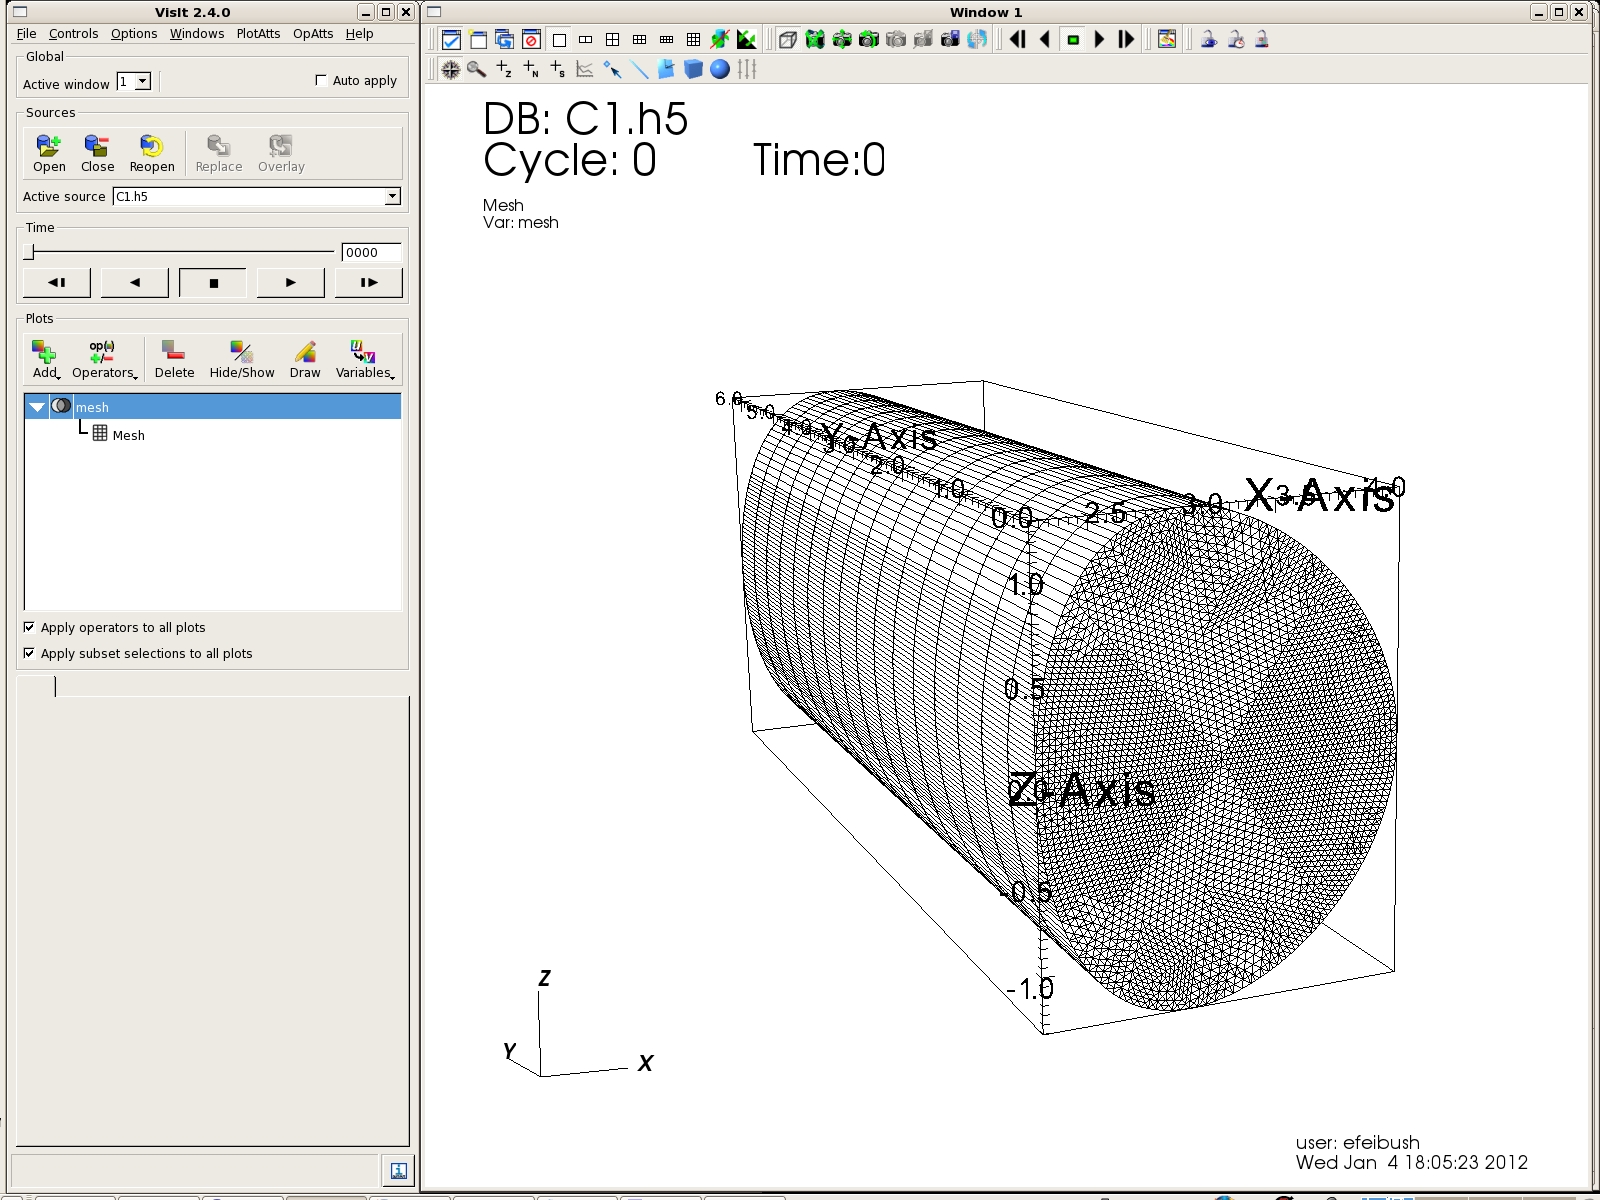
Rotate the mesh to a 3-D view by dragging the mouse cursor in the
display window.
To move the mesh horizontally and vertically, hold down the Ctrl key
while dragging the cursor.
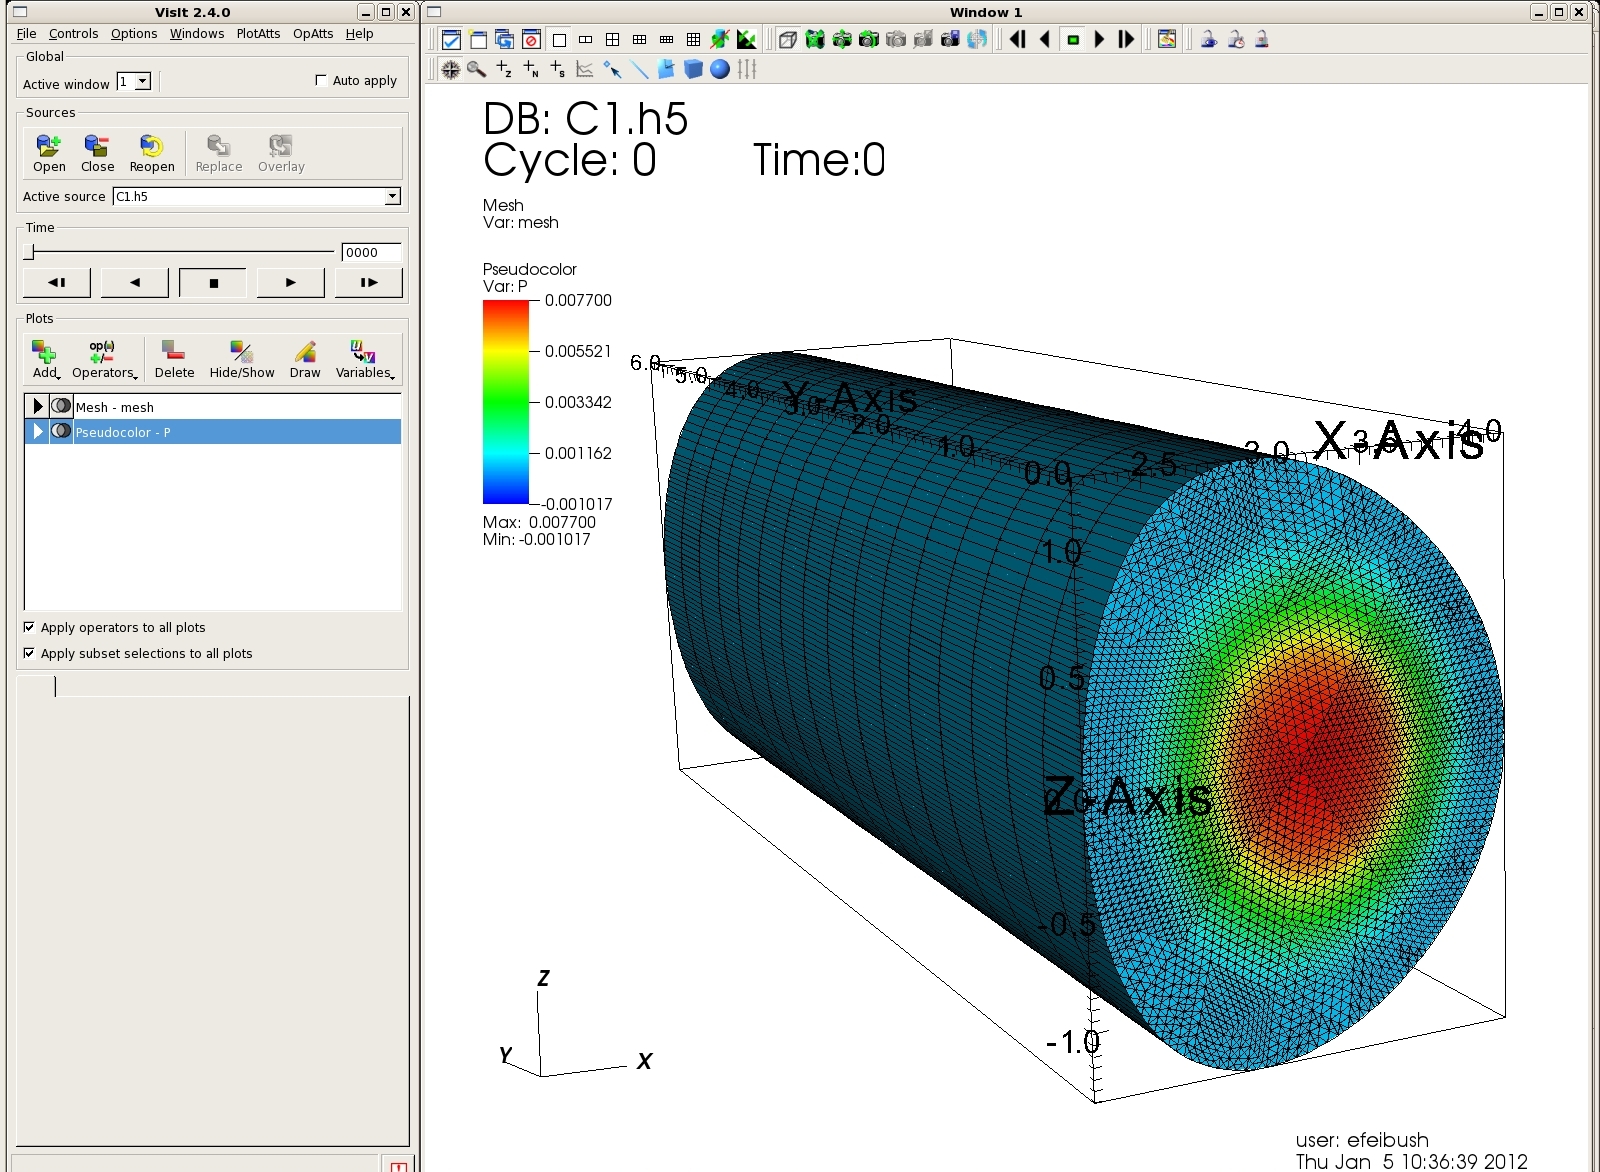
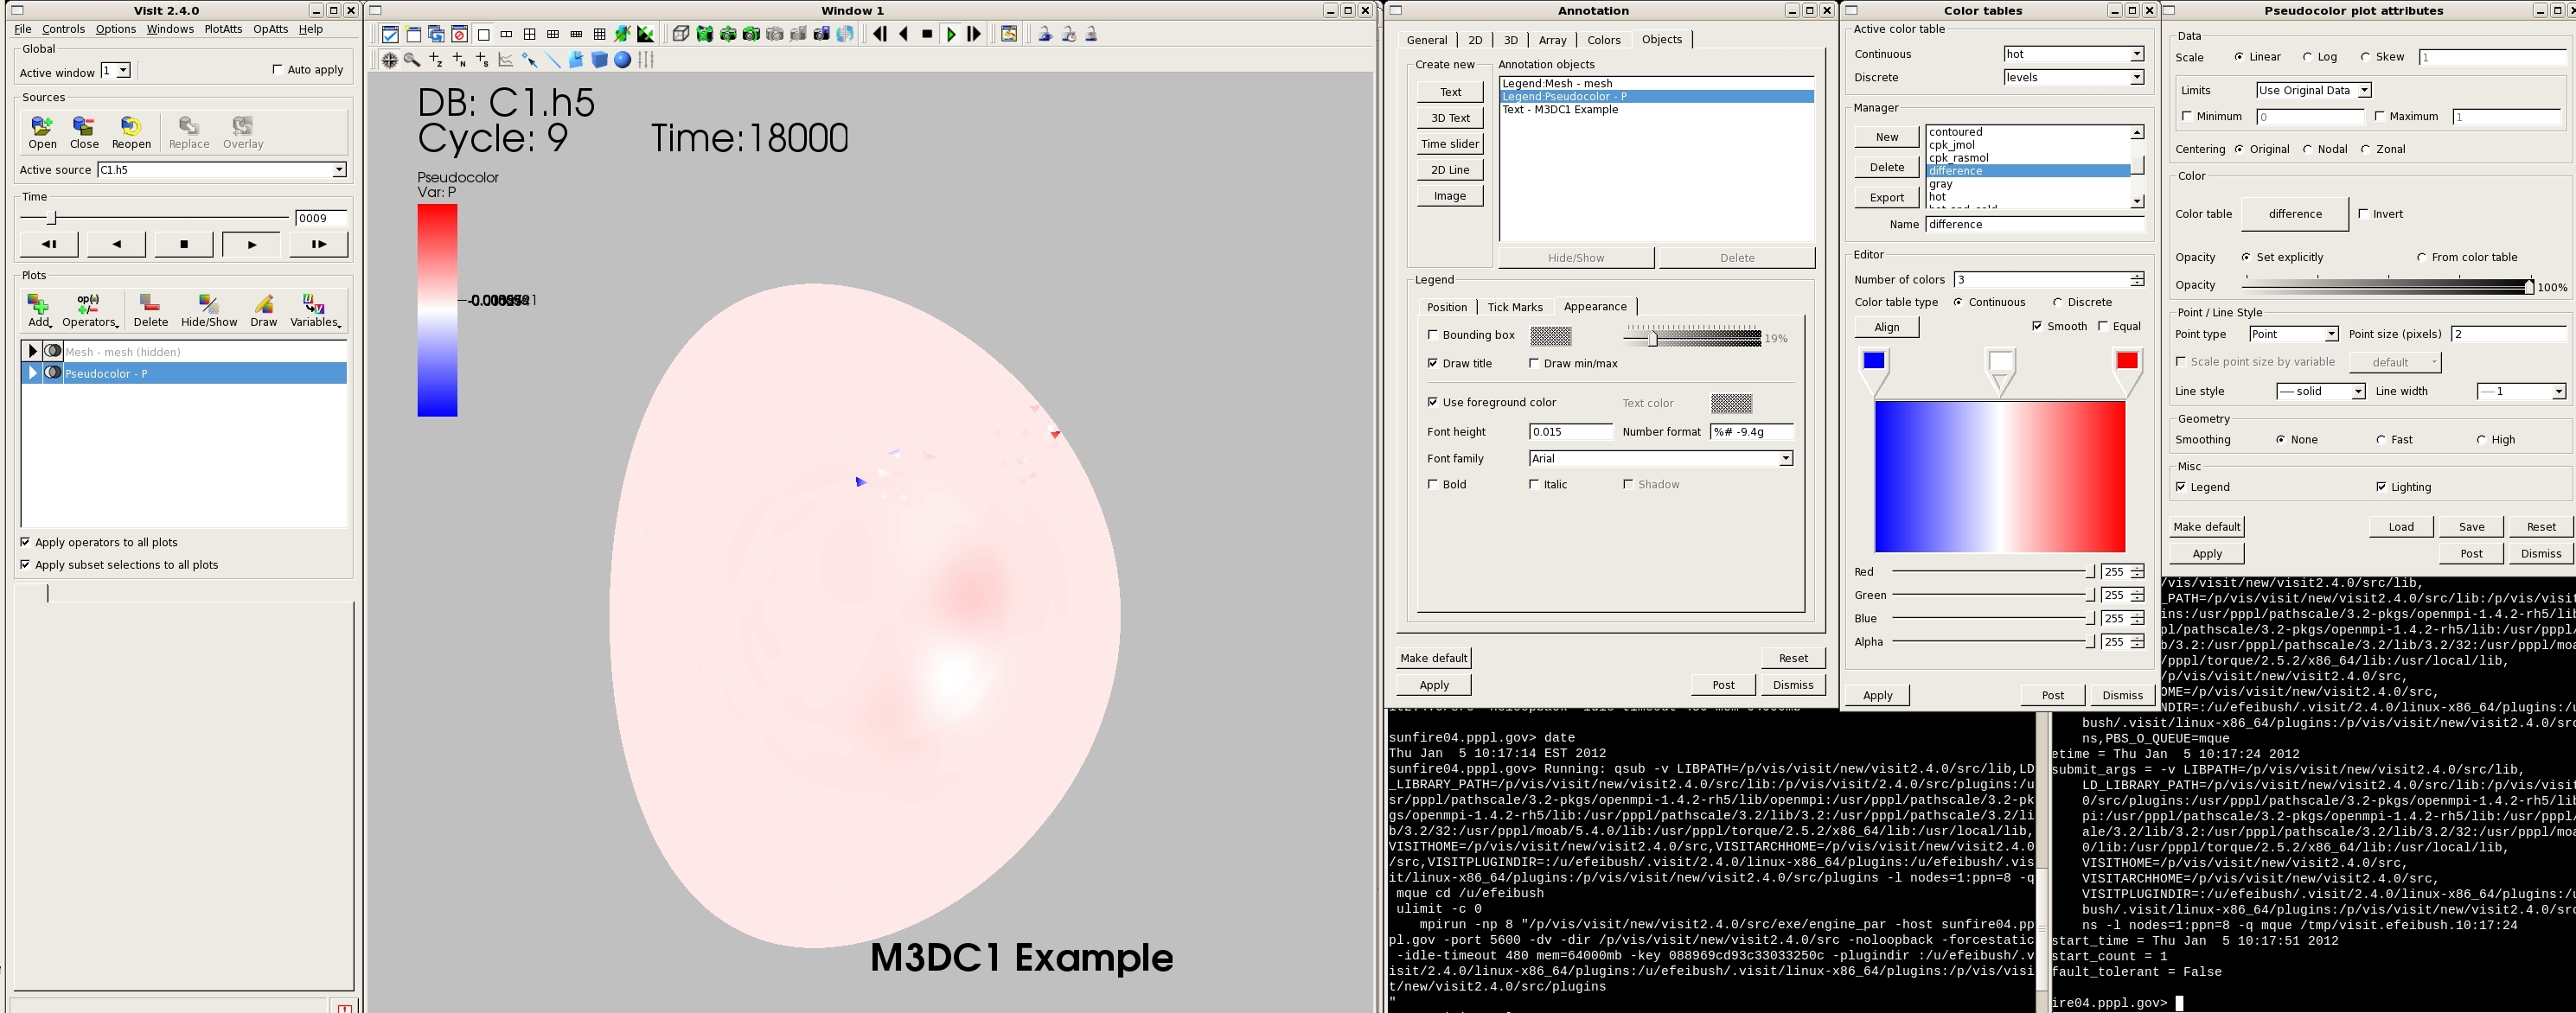
Add--->Pseudocolor for variable P
(Watch for rendering messages in the status area
at the bottom of the UI window. Takes almost 2 minutes to
draw).
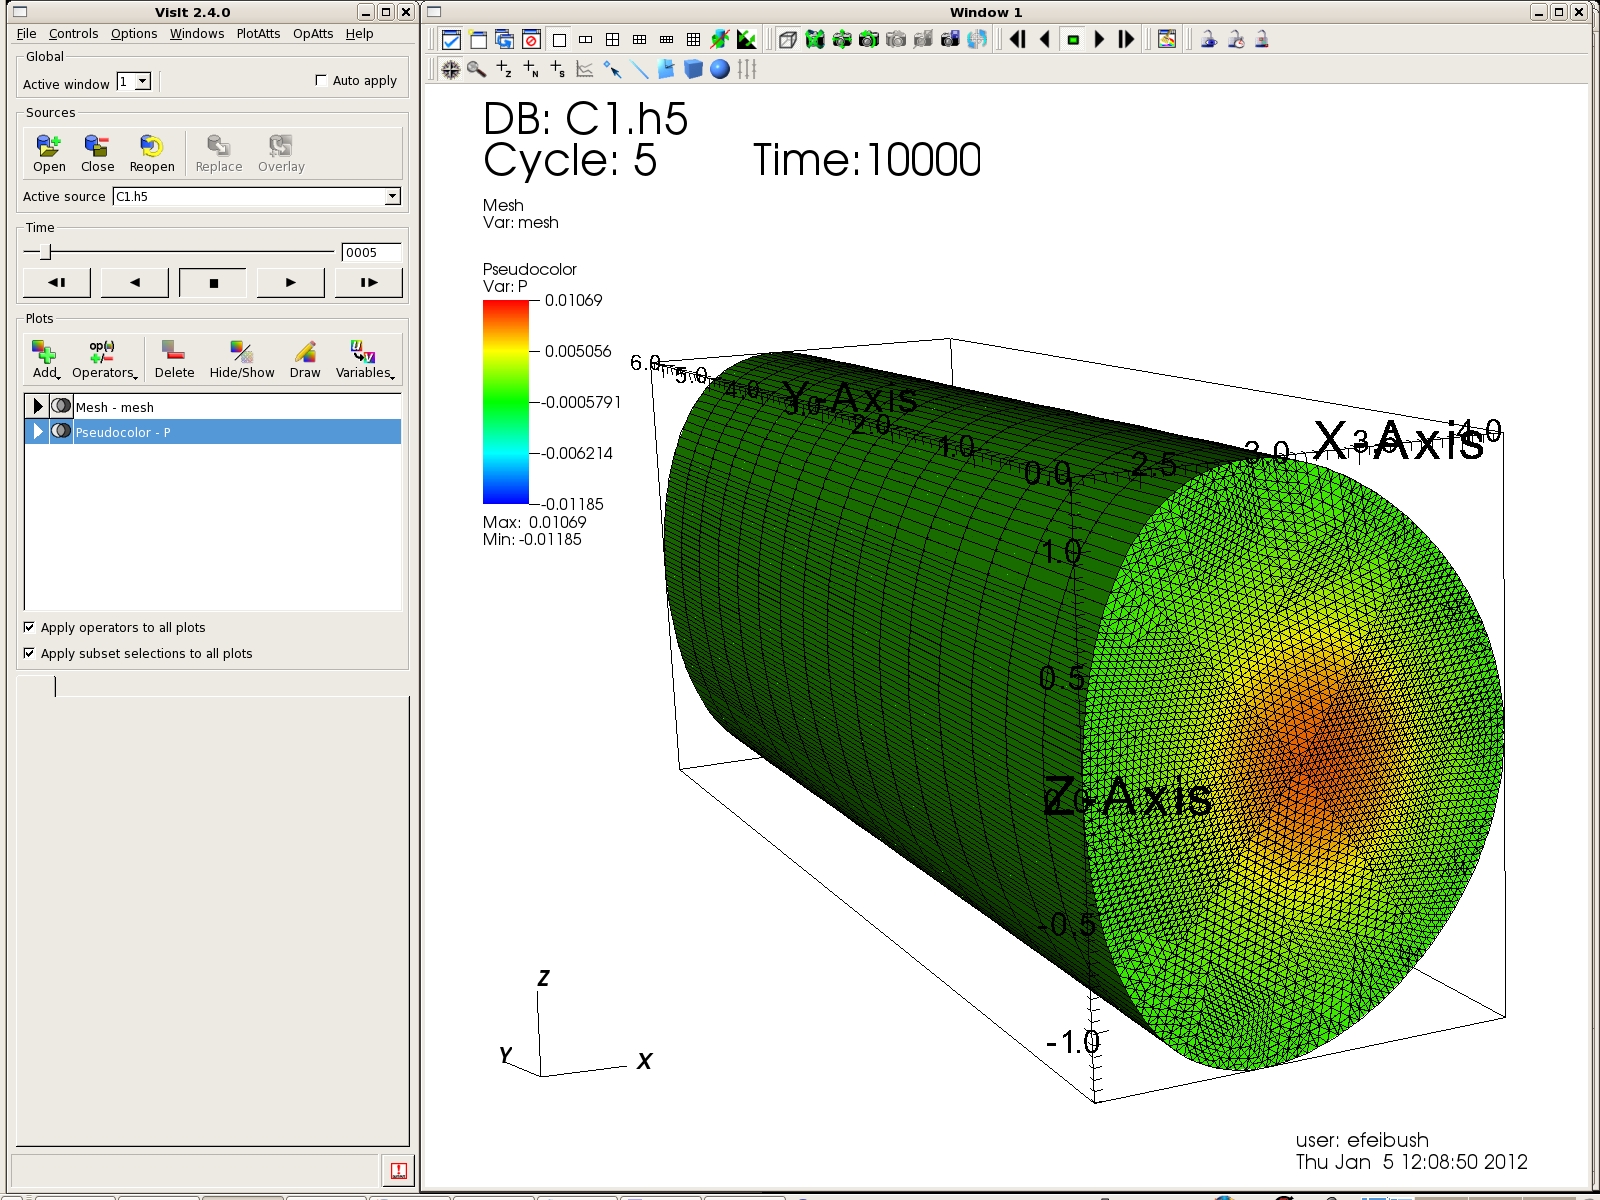
This dataset contains several time steps. Use the Time slider
to display another time step.
Redrawing each time step takes about 2 minutes.
4. Appearance
Displaying the pseudocolor plot can be time consuming.
Interactive view positioning will be faster when just the mesh is
displayed. Click on Pseudocolor in the plot list and then
click on Hide/Show to turn it off.
Go to the Controls--->View... menu. The 3D view tab will be
shown. Change the Align to axis field to -Y and turn off
Perspective. Click on Apply. Set the Image zoom to 1.9
and click on Apply.
Go to the Controls--->Annotation... menu. Click on the 3D
tab. Turn off Show axes, Show triad, and Show bounding
box. Go to the General tab, turn off User information, and
click Apply. This will display just the mesh.
To change the background color go to the Colors tab in the
Annotation menu and press down on the rectangle next to Background
color. This will bring up a palette of colors.
4.1 Legend
Click on Pseudocolor in the plot list and then click on Hide/Show to
display it.
Click on Mesh in the plot list and then click on Hide/Show to hide
it.
Go to the Objects tab in the Annotation menu and click on the Legend
Pseudocolor - P to select it.
Go down to the Legend panel in the menu. There are tabs for
Position, Tick Marks, and Appearance.
Use these controls to clarify the presentation of the legend.
For example, for Tick Marks, turn off the checkbox for Let Visit
determine tick labels. Then you can set the number of tick
marks and specify the label at each tick mark to simplify the
numbering if desired.
Go to the appearance tab and turn off Draw min/max.
Go to Controls--->Color table... to bring up the color map
menu. In the Manager section you can click on the name of each
color table to see its colors in the Editor area. You
can also create your own color table in this menu.
To actually use a different color table, go to
PlotAtts--->Pseudocolor...
Press down on the menu next to Color table and select a color table,
such as "difference". Then click on Apply in the Pseudocolor
menu to see the color change.
4.2 Labels
In the Annotation menu, click on Text to add a new label. Then
use the menu to set the text, font, location, etc. Click on
Apply to display the label.
5. Time Step Movie
To create a movie, go to File--->Save movie... This
brings up the movie wizard dialog box.
Select New simple movie and click Next.
Change the Format to JPEG images.
Click on the -> button in the center to put the JPEG images
format into the Output list. Click Next.
Specify the First frame (time step) and Last frame (time
step). You can ignore Frames per second for now. Click
Next.
Specify the Output directory for the JPEG image files. You can
specify a base name for the files. Click next.
Ignore email notification, click Next.
Select Now, use currently allocated processors. Click Finish.
This brings up a progress dialog box and a window that runs a
script.
By default, VisIt renders each time step with its min-max data
range. This is usually undesirable for a movie where each
frame should be rendered against a consistant scale. For
consistancy over all time steps, go to the Pseudocolor plot
attributes window and set the global Minimum and Maximum for your
data. Unfortunately VisIt does not calculate the global
range. You may have to look at a number of the time steps to
determine the global min-max.
Then go to the Annotation window and select the Legend Pseudocolor -
P. You may have to change the Labels for the tick mark values.
The JPEG images are used to create a movie file. One technique
for creating the movie file on the PPL cluster is to run this java
program:
module
load java/v1.6
java -jar
/u/efeibush/w3_html/makemovie/jpegtomovie.jar -f 5 -o mymovie.mov
-d /u/efeibush/example
In this command line it creates a QuickTime movie file with 5 frames
per second. The output file is named mymovie.mov. The
image files are located in /u/feibush/example.
6. 3-D Torus
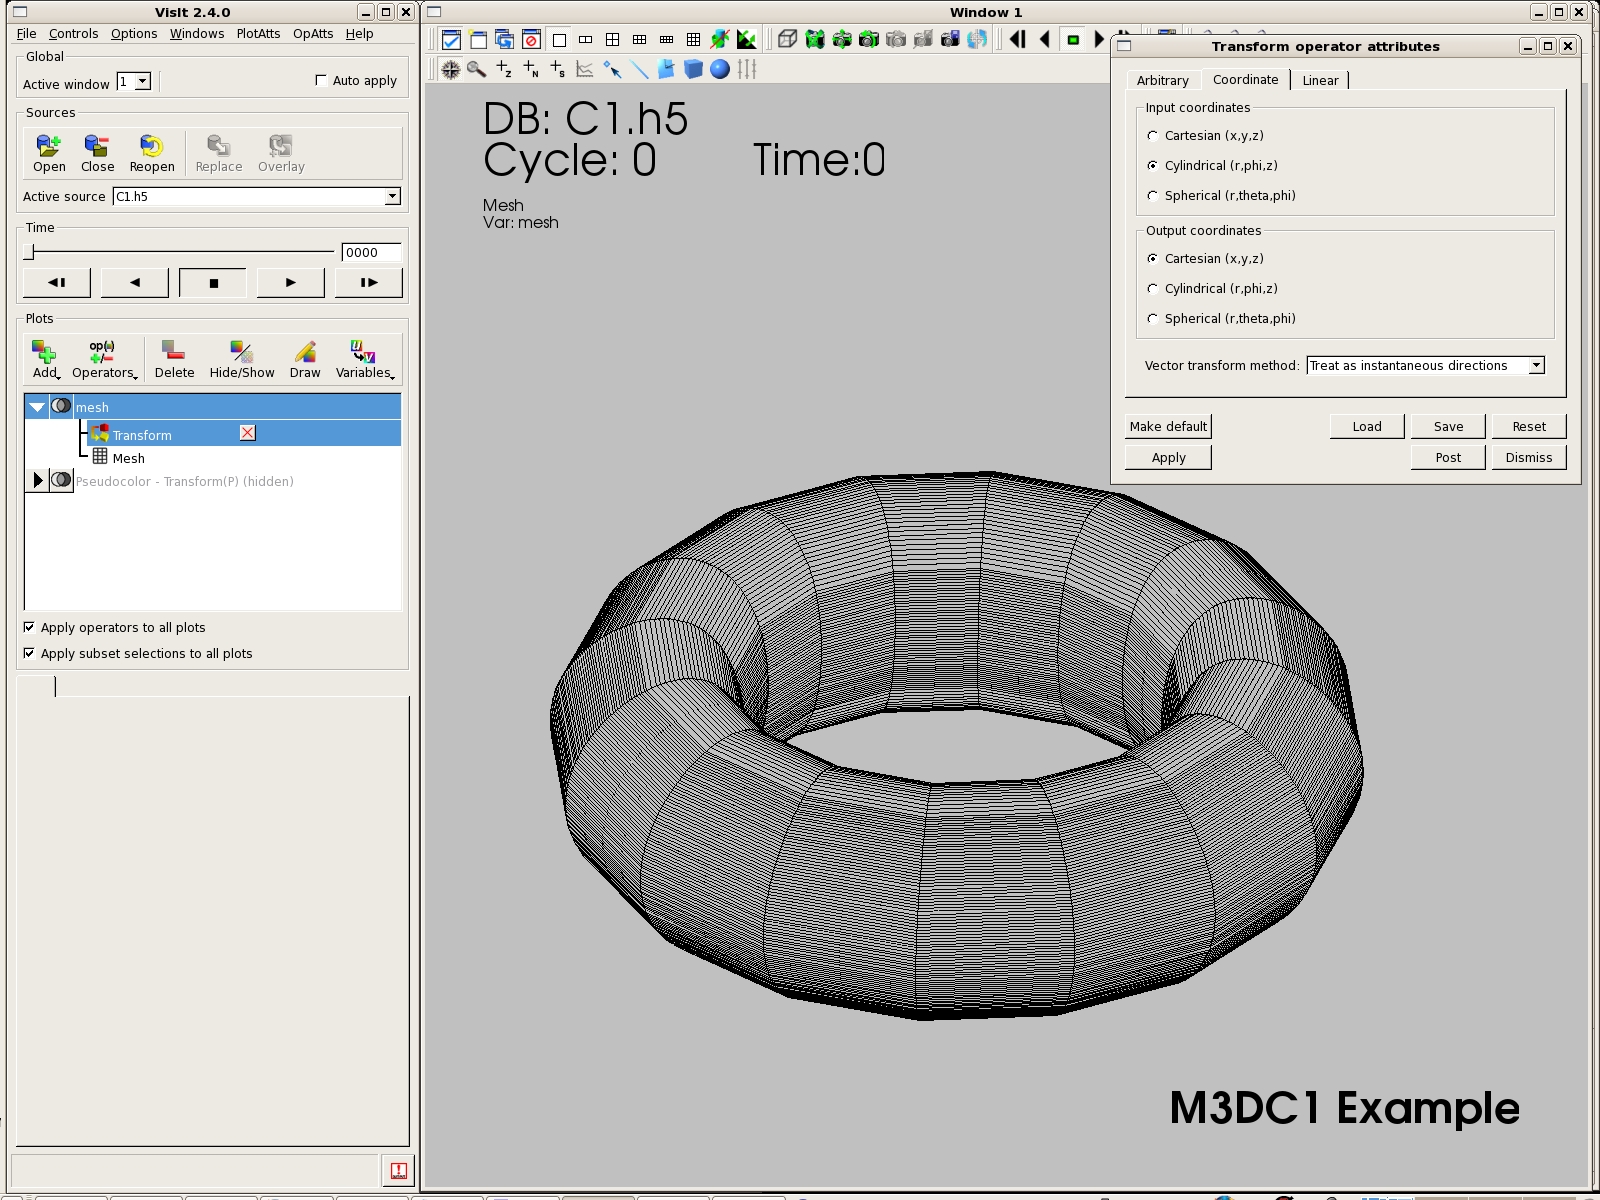
Select the mesh in the list of plots. Go to
Operators--->Transforms--->Transform. This adds a
transformation to the mesh. Double click on Transform in the
list to bring up the Transform operator attributes menu. Go to
the Coordinate tab. Set Input to Cylindrical and Output to
Cartesian. Click on Apply and Draw.
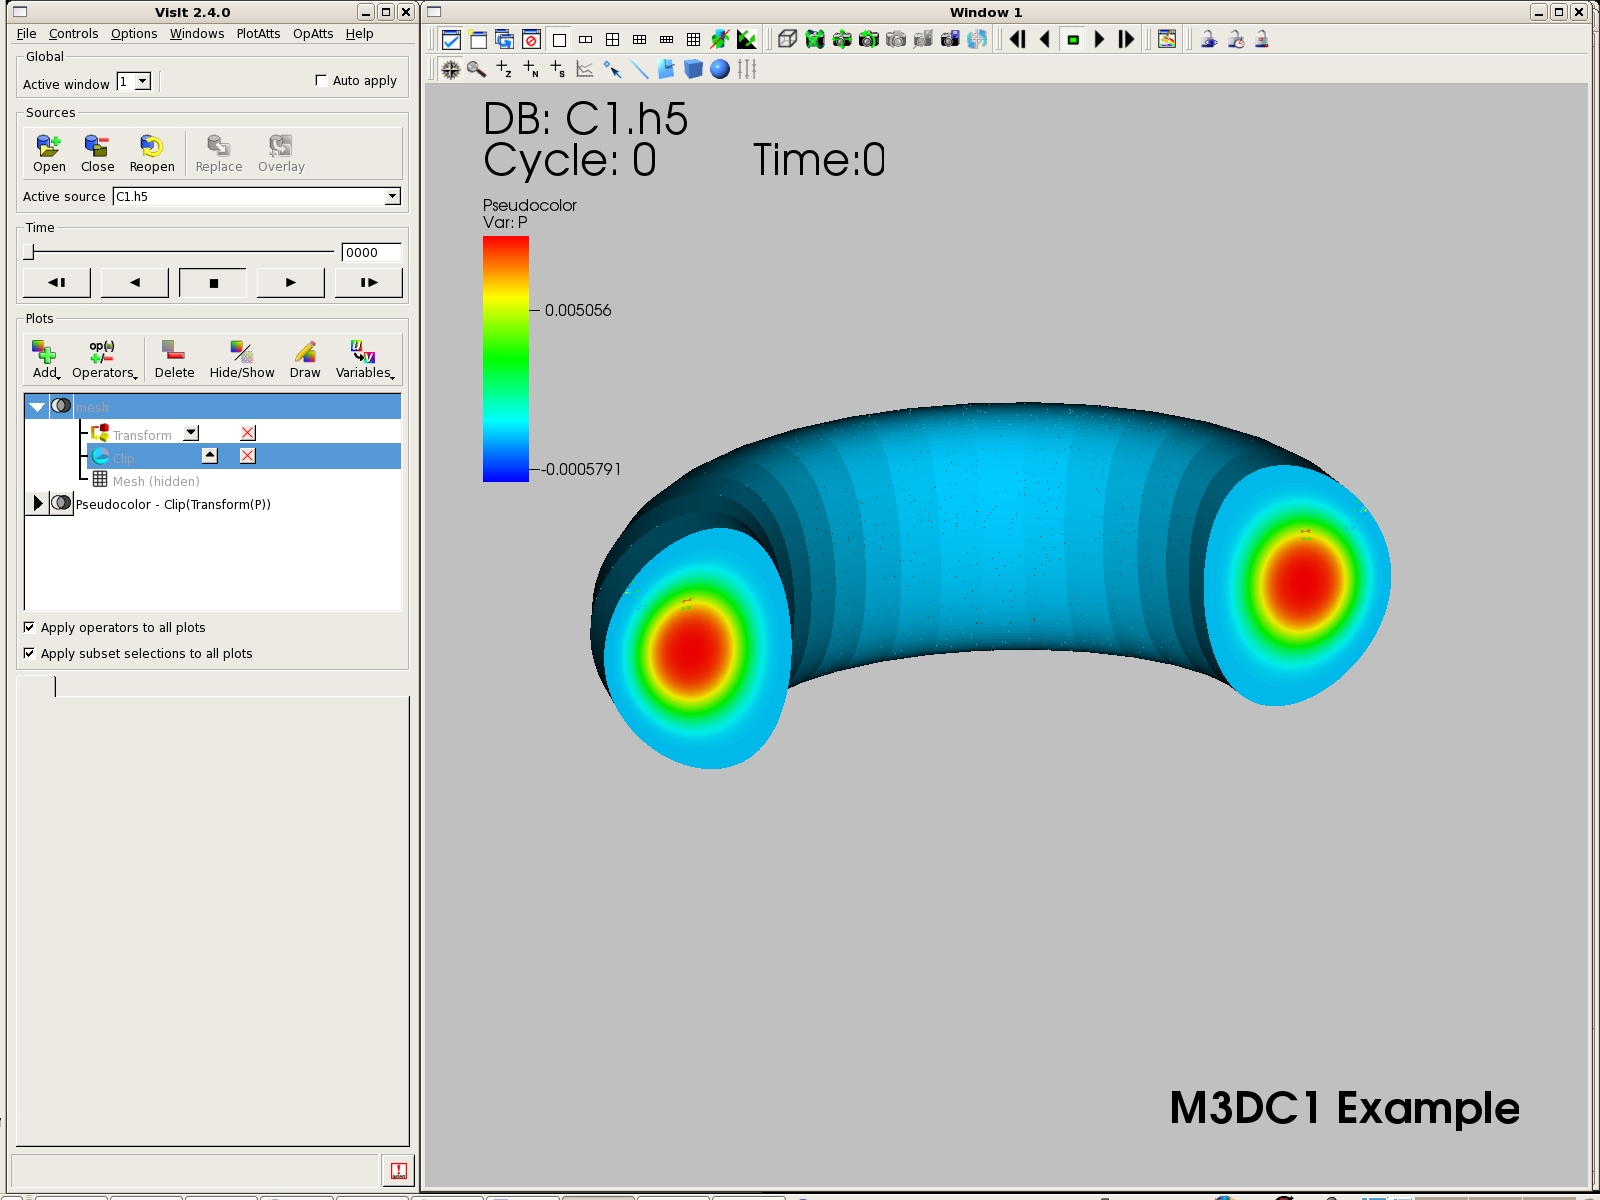
Go to Operators--->Selection--->Clip and click on Draw.
Rotate the view to see the cross sections.
Show the pseudocolor plot and hide the mesh plot.
6.1 Isosurface
Turn off: Apply operators to all plots and Apply subset
selections to all plots.
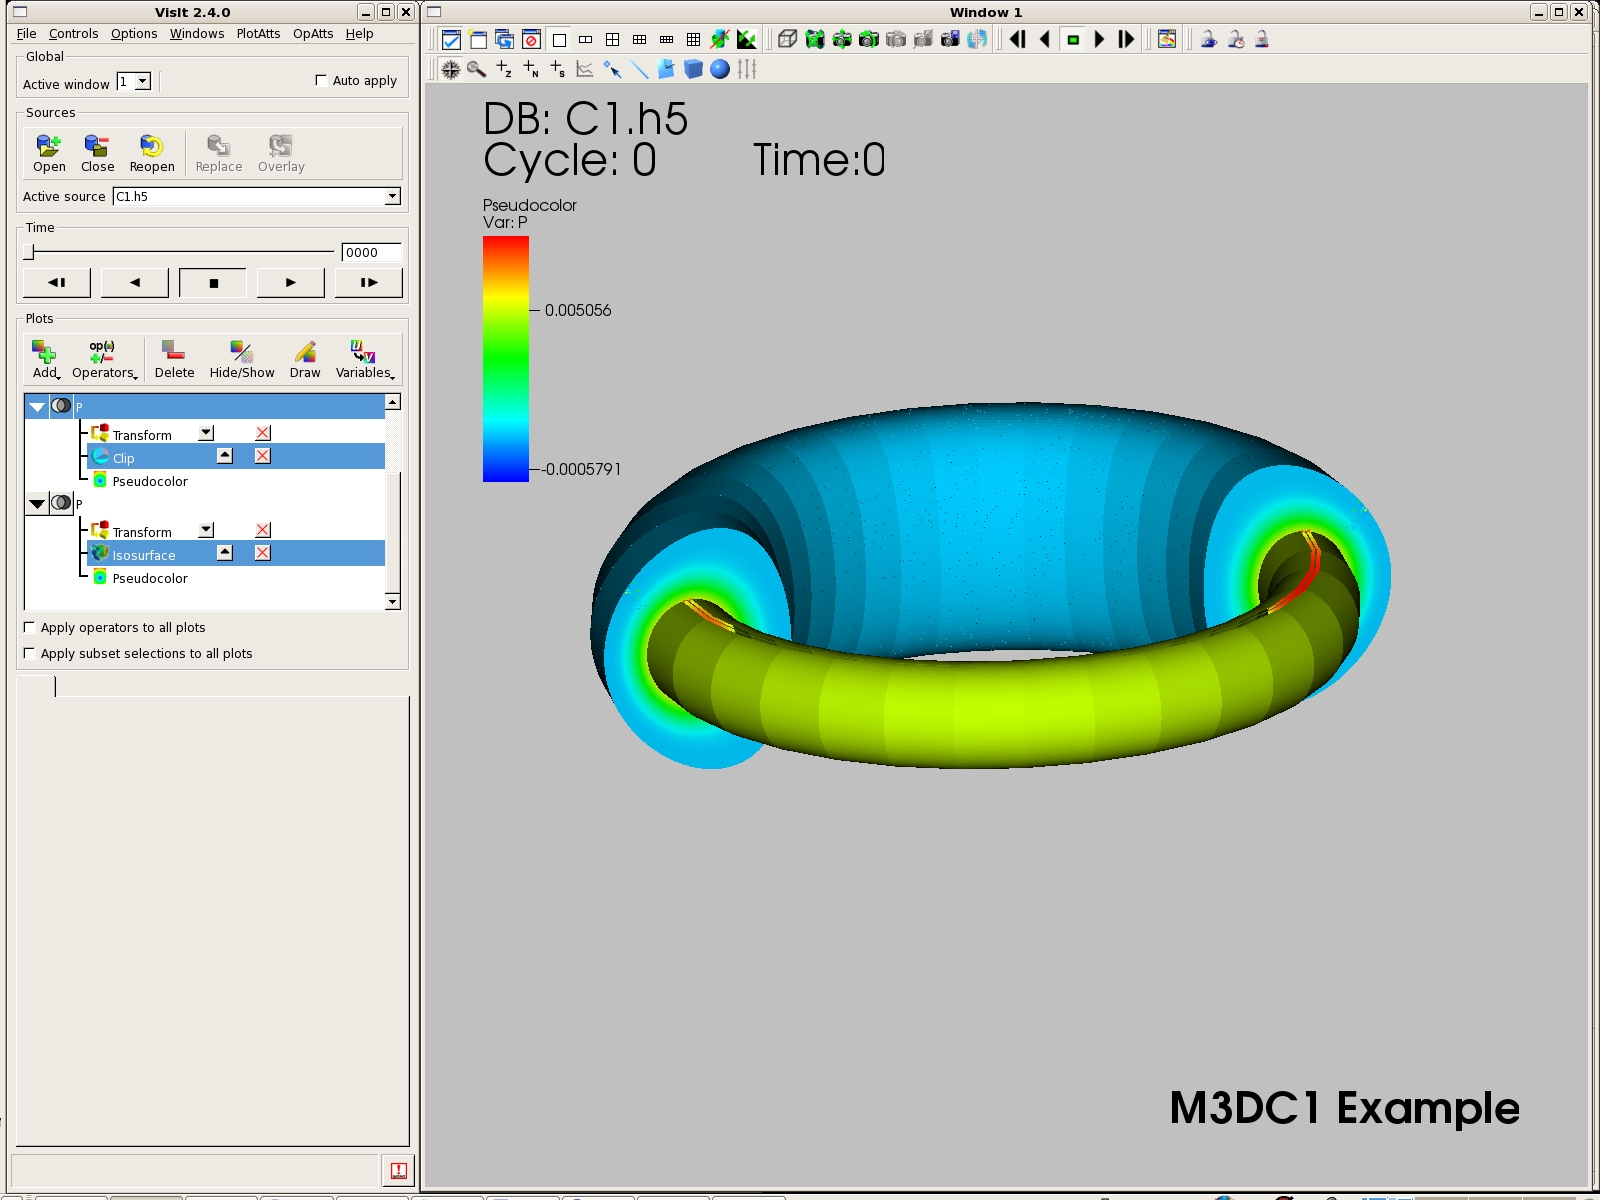
Add another pseudocolor plot and then add the same transform
operator to it.
Then go to Operators--->Slicing--->Isosurface.
Double click on Isosurface in the plot listing to bring up the
Isosurface operator attributes menu.
Set Select by to Value(s). Enter a value, such as .005.
Click Apply and Draw.
An additional legend is normally drawn for the isosurface. To
suppress this legend double click on Pseudocolor listed below
Isosurface. This will bring up the menu window for Pseudocolor
plot attributes. Uncheck the Legend box and click Apply to
turn off the additional legend.
6.2 Slice Plane
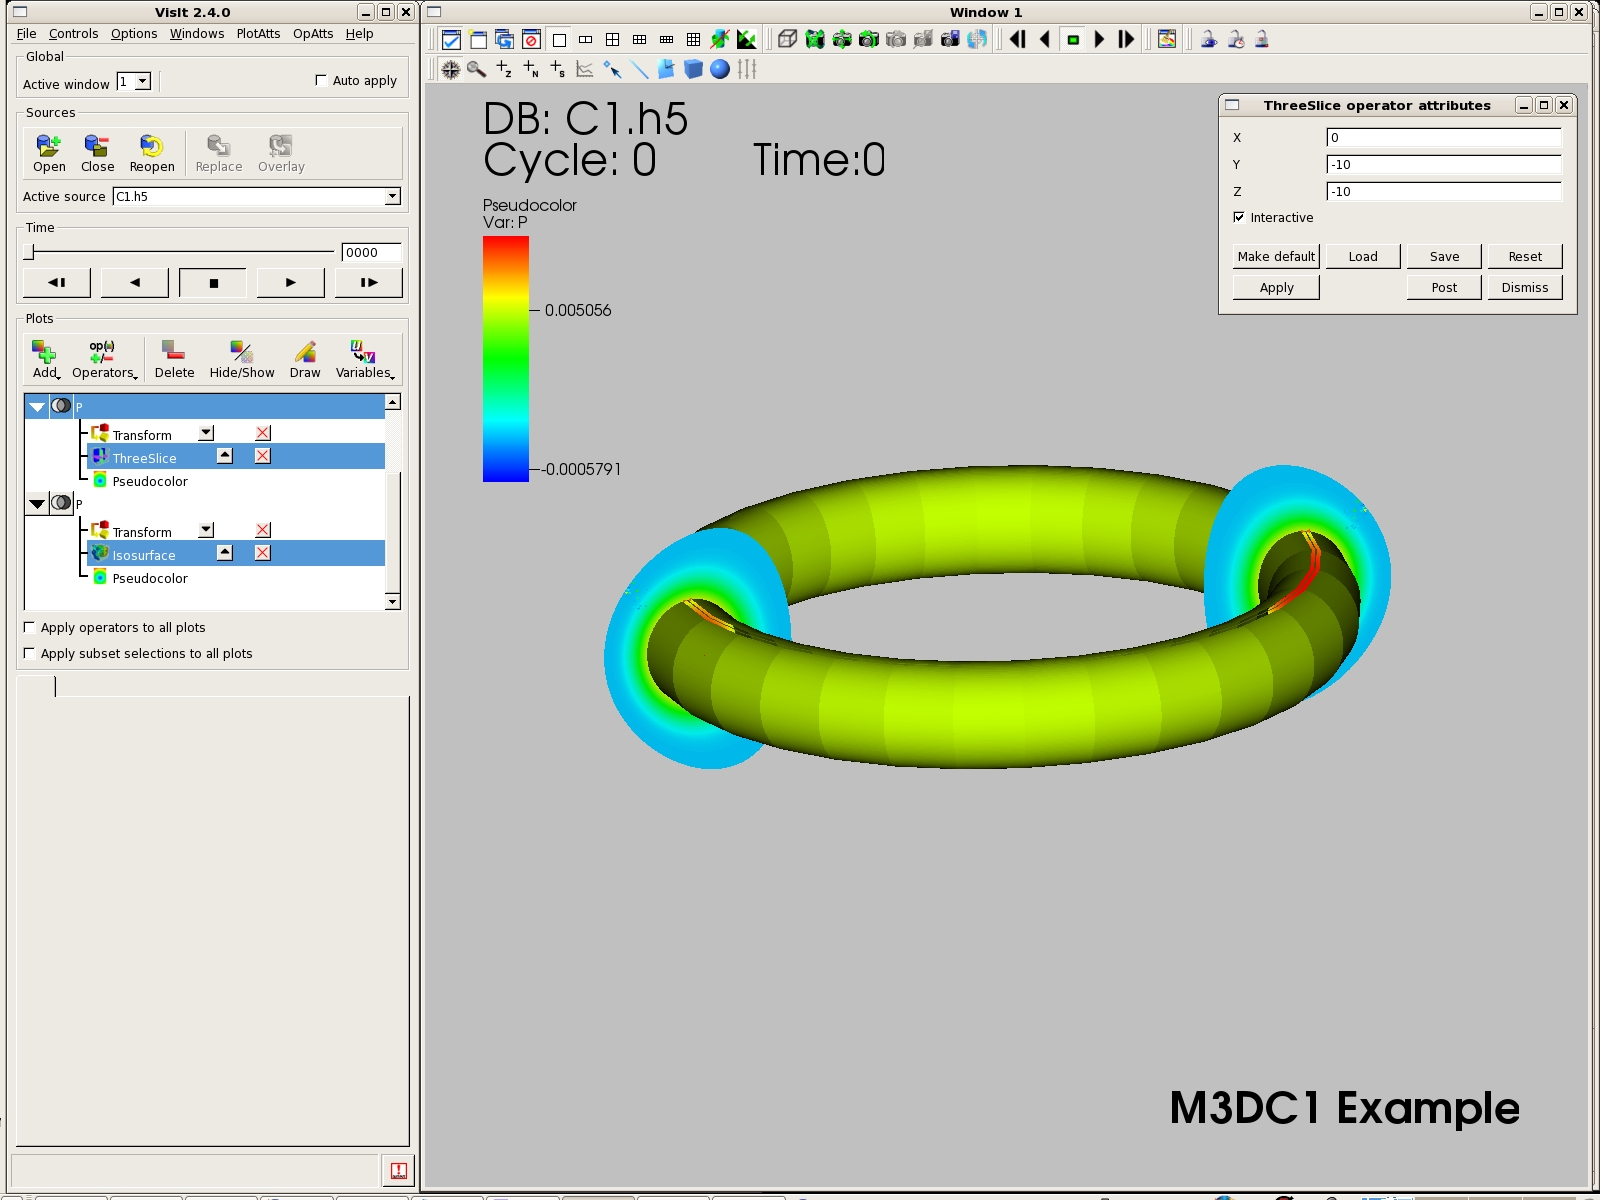
Select the first pseudocolor plot from the list. Remove the
Clip operator by clicking on the red X.
Then go to Operators--->Slicing--->ThreeSlice. Click on
Draw. Initially this will display 3 planes intersecting the
torus.
Double click on ThreeSlice in the list of plots to bring up the
ThreeSlice operator attributes window. Set Y to -10 and Z to
-10 to move those 2 slice planes outside of the torus. Click
Apply and only the 2 cross sections in the X = 0 plane will be
displayed as shown.
Use the instructions in section 5 to make a time step movie of the
isosurface visualization.