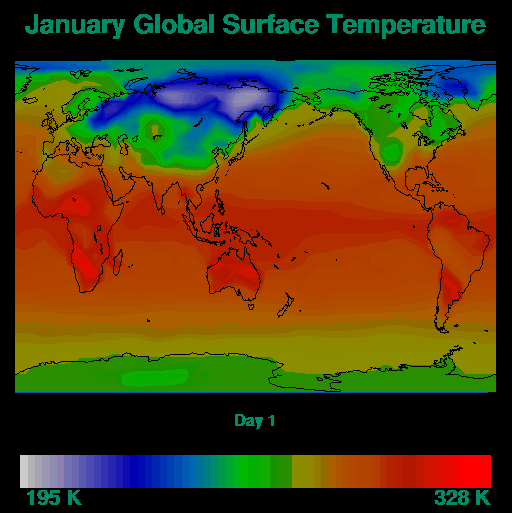
ContourPlot example 5


This example can be created using HLU C library calls, HLU FORTRAN
library calls, or NCL. It demonstrates how to read data from a netCDF
file, set plot attributes, and generate a color-filled contour plot
with a labelbar overlaid on a cylindrical equidistant map projection
of the globe. The example also shows how to iteratively loop through
the data and generate multiple plots to create an animation. The
names of the example codes that create this plot are cn05c.c, cn05f.f,
and cn05n.ncl.

View this animation.
This module discusses how to create the previous plot using HLU
function calls and NCL. This module also shows how to read netCDF
data from a file, create a scalar field data object, a workstation
object for output to an NCGM workstation, a contour plot, a labelbar
as an annotation object to a contour plot, and a MapPlot object. There
is no resource file for this example, as all the resources are set
in the source code.
The HLU C program that generates this plot is called cn05c.c.
The HLU FORTRAN program that generates this plot is called cn05f.f.
The NCL script that generates this plot is called
cn05n.ncl.
The data for this plot is from a netCDF file called meccatemp.cdf. The
original data for this plot was generated by Warren Washington (NCAR)
and Gerald Meehl (NCAR) for the Model Evaluation Consortium for
Climate Assessment (MECCA)
project. The MECCA Analysis Team at the Climate Impacts Centre in
Sydney, Australia, prepared and archived the data, and previous
visualizations of this data by Kendal McGuffie (University of
Technology, Sydney) were referenced for selecting appropriate
attributes for the plot and animation.
The data file contains a three-dimensional array of temperature
data. The dimensions of the temperature variable (t) are time (31),
lat (40), and lon (49).
The data file is located in your NCAR Graphics data directory in a
subdirectory called "cdf". You can get the name of the data directory
by typing "ncargpath data" at your shell prompt. If you have netCDF
installed on your system, then you can change directory to where the
netCDF file resides and type "ncdump -h meccatemp.cdf" to view the
header information for this data file.
The examples are installed in the following locations:
- $NCARG_LIB/ncarg/hluex/contourplot/cn05c.c
- $NCARG_LIB/ncarg/hluex/contourplot/cn05f.f
- $NCARG_LIB/ncarg/nclex/contourplot/cn05n.ncl
The netCDF data file is installed in the following location:
- $NCARG_LIB/ncarg/data/cdf/meccatemp.cdf
You can copy this example and run it by typing "ng4ex cn05c", "ng4ex
cn05f", or "ng4ex cn05n". A copy of the source file will be placed in
your current working directory. The source code will be compiled and
automatically run for you. You must have the netCDF library
installed on your system in order to compile the C or FORTRAN version
of this example.
You can view the output NCGM file using the NCAR Graphics ctrans utility.
(For example, to view the file generated from cn05n.ncl,
type "ctrans -d X11 cn05n.ncgm".)
Quick Start Guide Control Panel
NG4.1 Home, Index, Examples, Glossary, Feedback, QSG Contents, QSG WhereAmI?
$Revision: 1.11 $ $Date: 1999/03/23 18:34:12 $


