1. Running RPLOT with ElVis
The TRANSP RPLOT program is integrated with ElVis. RPLOT's
basic function consists of an xterm command line window and an xterm
display window. RPLOT has been extended to send its graphs to
ElVis for enhanced display:
1. Multiple, simultaneous
graphs.
2. Color plots.
3. Interactive data exploration: pan, zoom, dynamic
numerical readout, interactive log plots.
4. Variety of presentation styles for f(x,t) data.
5. Publication quality output to PostScript or PDF files.
6. Animation of multi-dimensional data.
RPLOT uses inter-process communication over sockets to send graphs
to ElVis. A socket is defined by the computer name and port
number.
1.1 Run ElVis
Start ElVis running and note the port number and computer name in
the title bar. Running ElVis on a sunfire machine, e.g. would
show:
7654 sunfire07.pppl.gov
ElVis is listening on the socket at port number 7654 on
sunfire07. That is the default port number for ElVis. If
that number is in use ElVis will increment to the next available
port number.
1.2 Run RPLOT on portal
Start an xterm command line window on one of the portal
computers. Prepare the environment variables using:
module load ntcc/xshare
module load intel
Set your ELVIS_SERVER environment variable to the computer running
ElVis (in this case, sunfire07):
setenv ELVIS_SERVER sunfire07
If you are running ElVis on your laptop, e.g. then specify its
name: setenv ELVIS_SERVER efeibush-lt1.
RPLOT will use 7654 as the default port number. If ElVis is
showing a different port number, then set the ELVIS_PORT environment
variable to the port number in the titlebar.
Then run RPLOT. It should print a line:
%RPLOT:
detected ELVIS_SERVER = "sunfire07".
1.3 Example RPLOT session
;*RPLOT* MAIN:
ENTER RUN ID (MAX 8 CHARS) OR 0 TO QUIT$
t
;RPLOT: mds control
option:$
y nstx.14
;RPLOT: mds control
option:$
q
;*RPLOT* MAIN: ENTER
RUN ID (MAX 8 CHARS) OR 0 TO QUIT$
129017a01
; RPLOT:MAIN
ENTER OPTION NUMBER:$
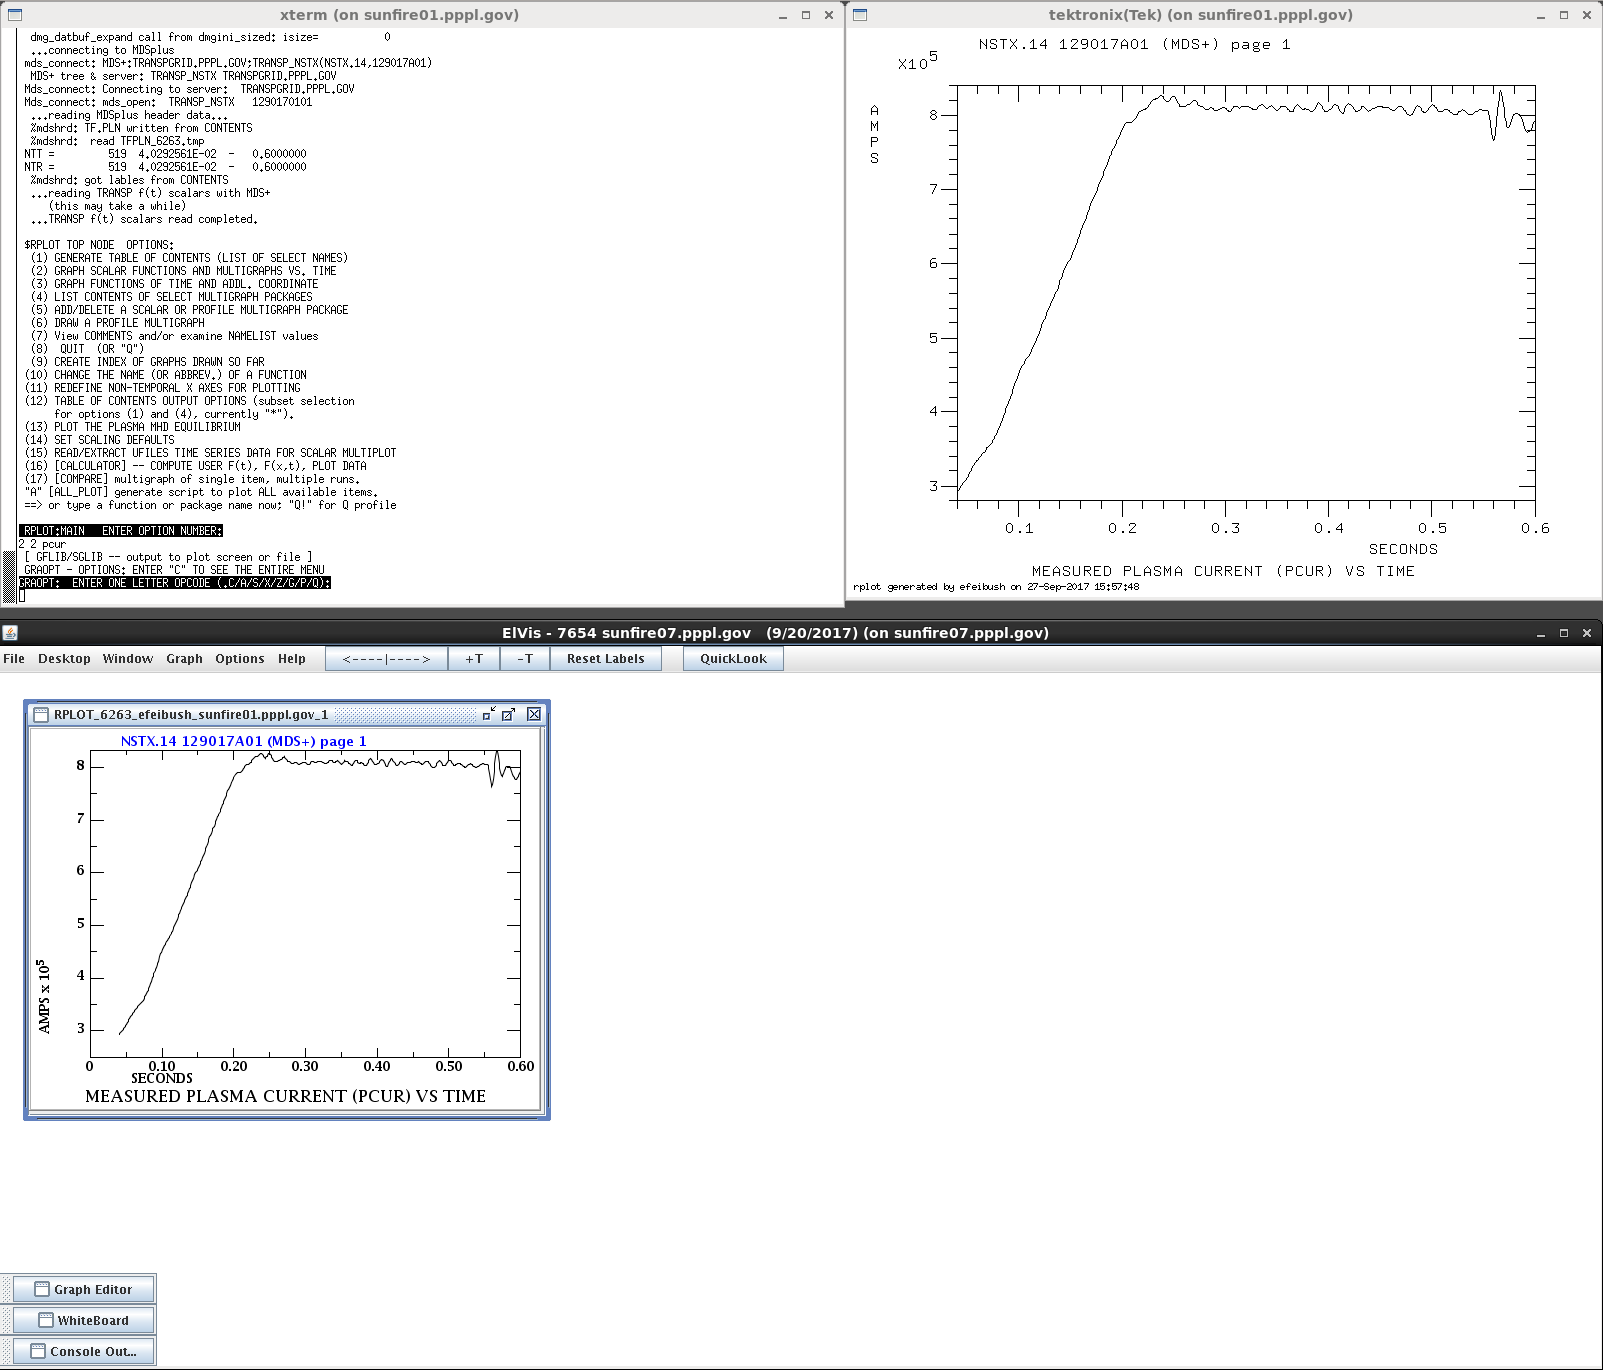
2 2 pcur
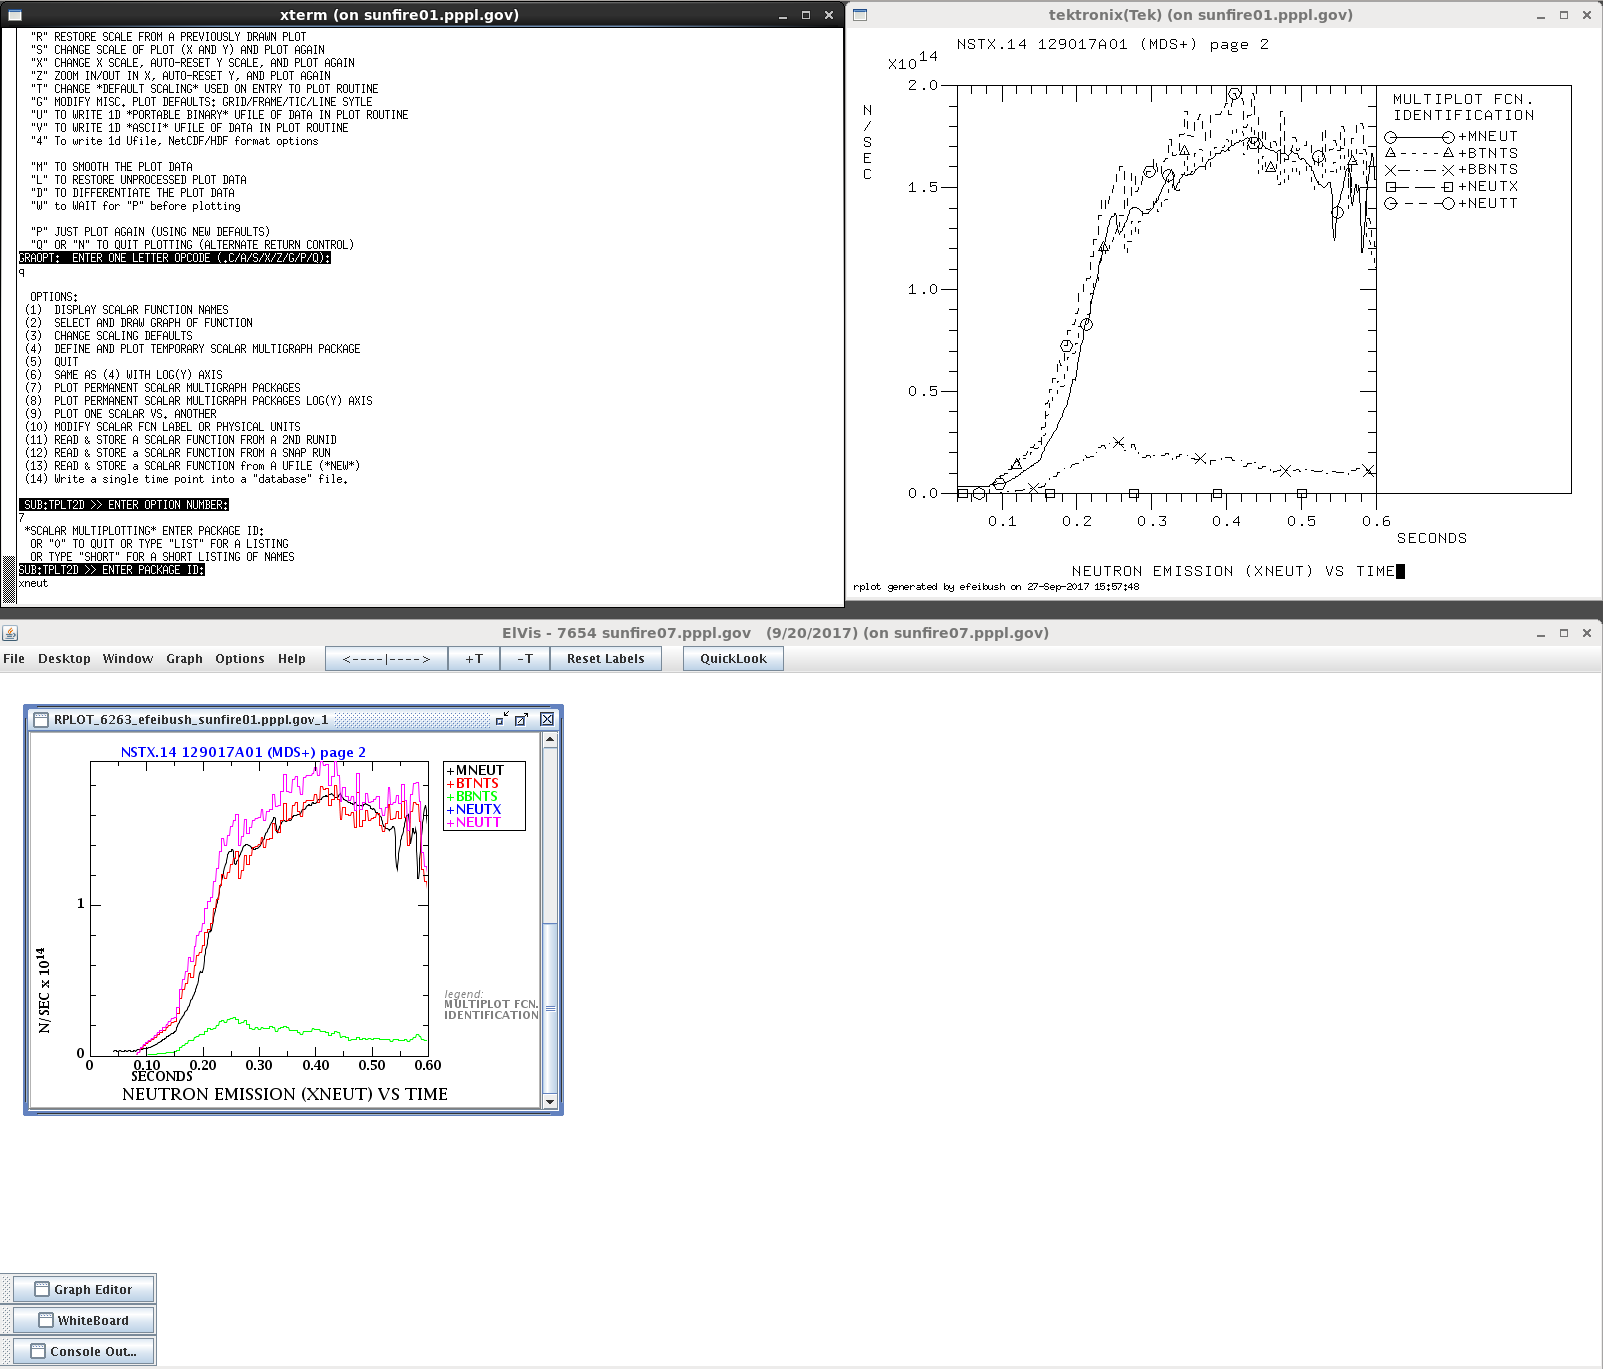
RPLOT will draw the graph of Plasma Current in a new tektronix
window and will also send the graph description to ElVis. When
ElVis receives the data it will make the plot in its window as shown
below.
Subsequent plots will be added to the same window in ElVis.
Note the vertical scrollbar with the new plot in ElVis below: