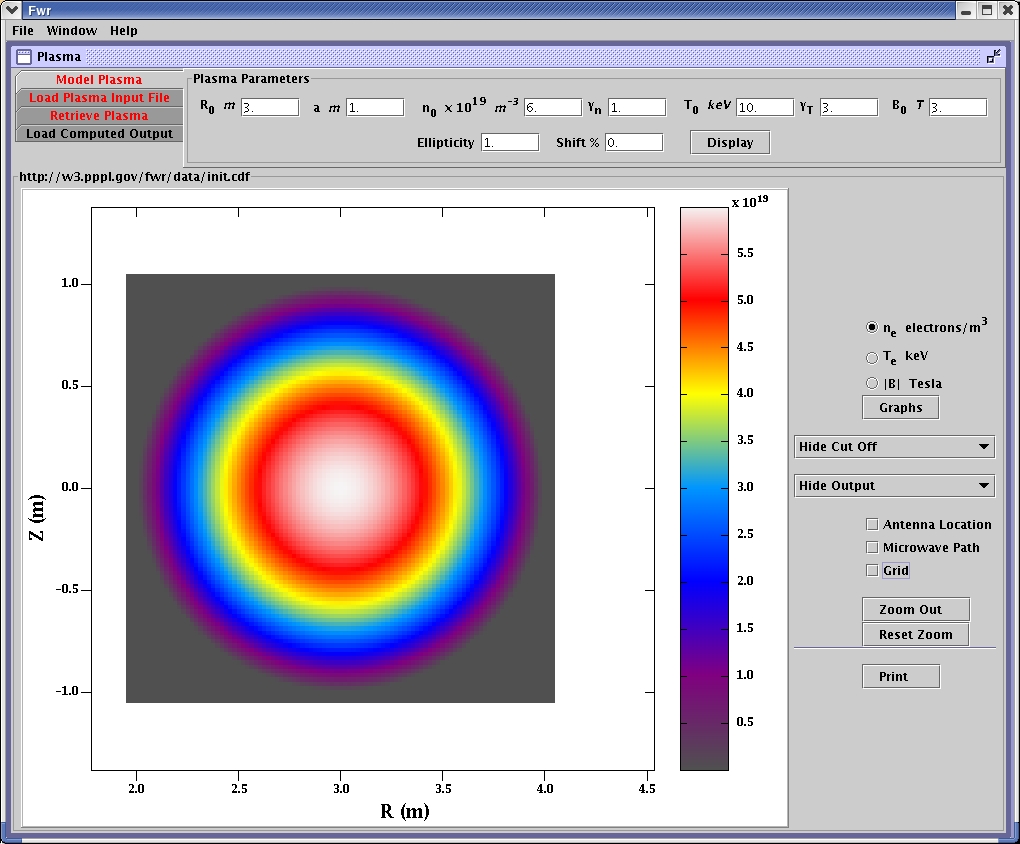
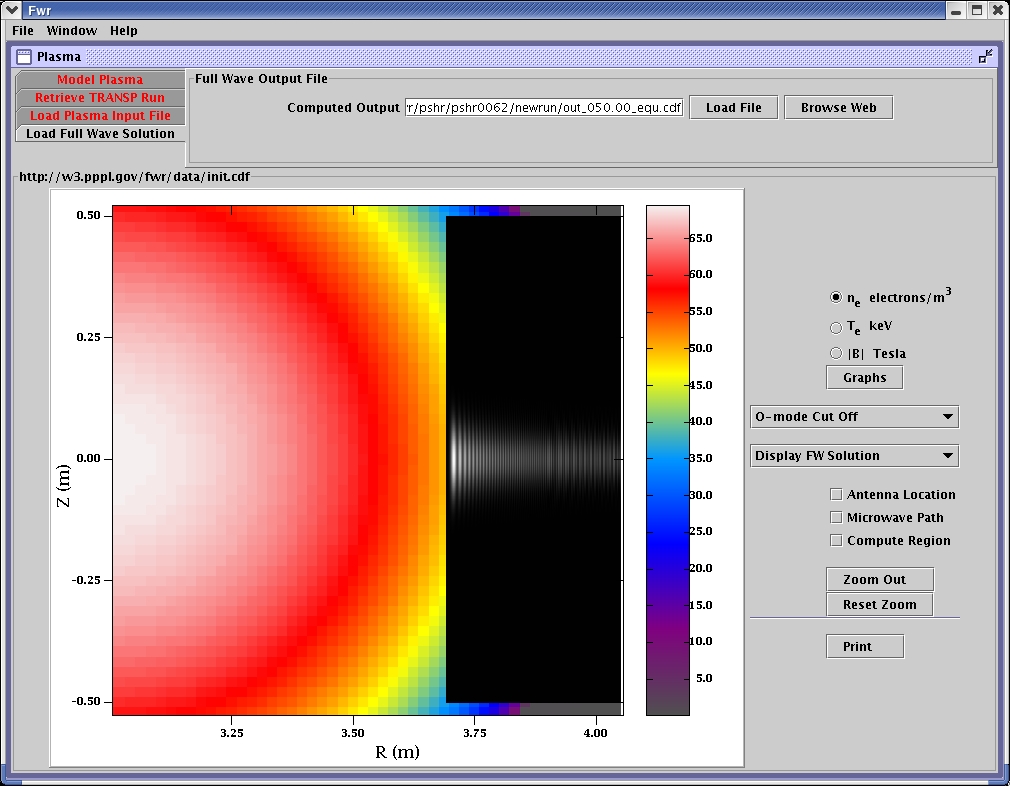
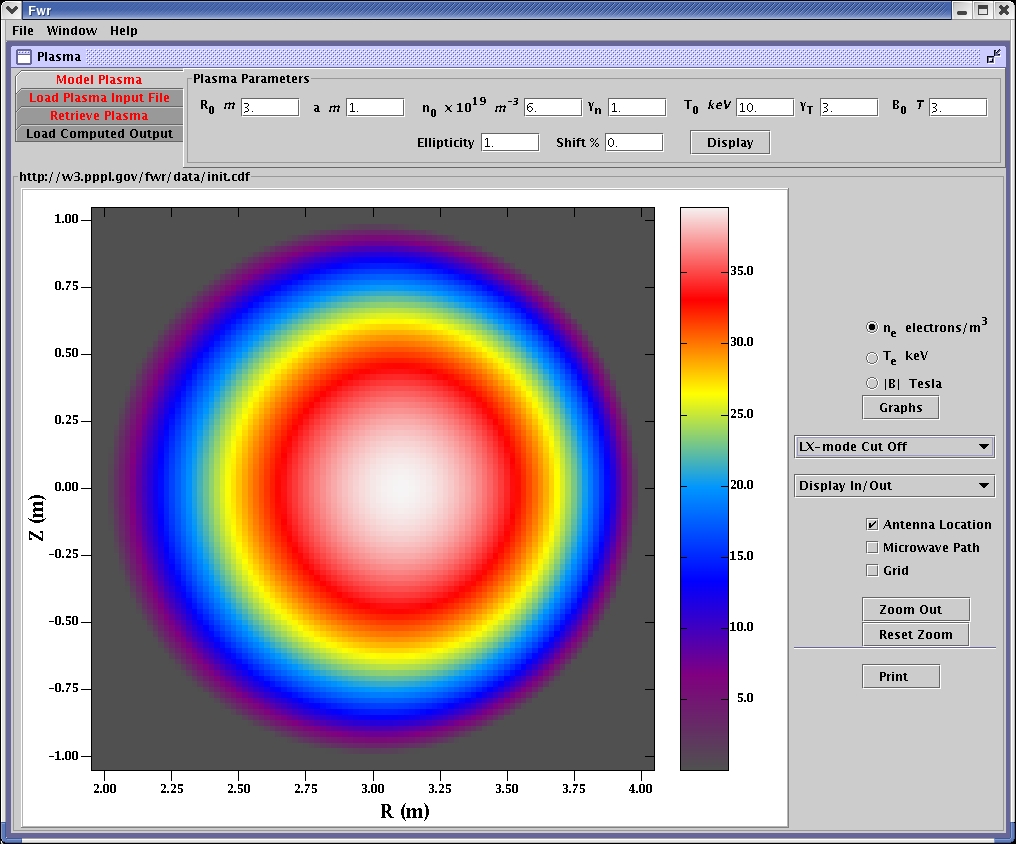
Plasma modeled from initial parameters, display of electron density.
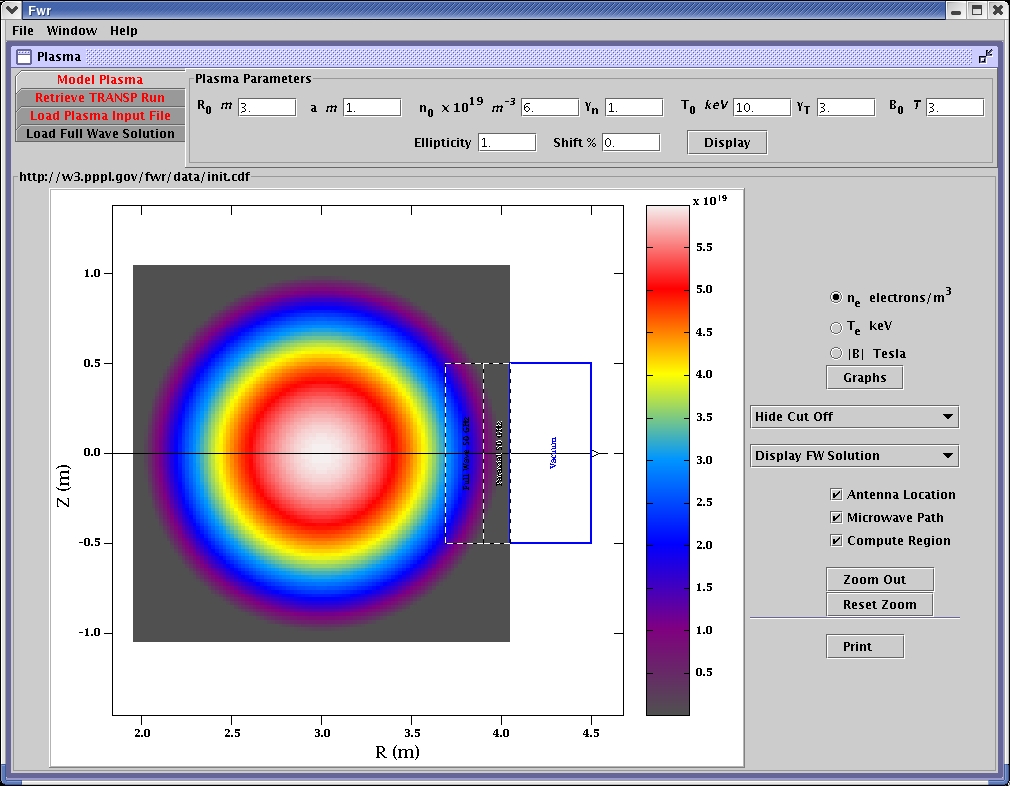
Computational grid for 50 GHz is displayed relative to electron density. Full wave and paraxial compute regions are shown. The antenna is on the right edge of the vacuum area.
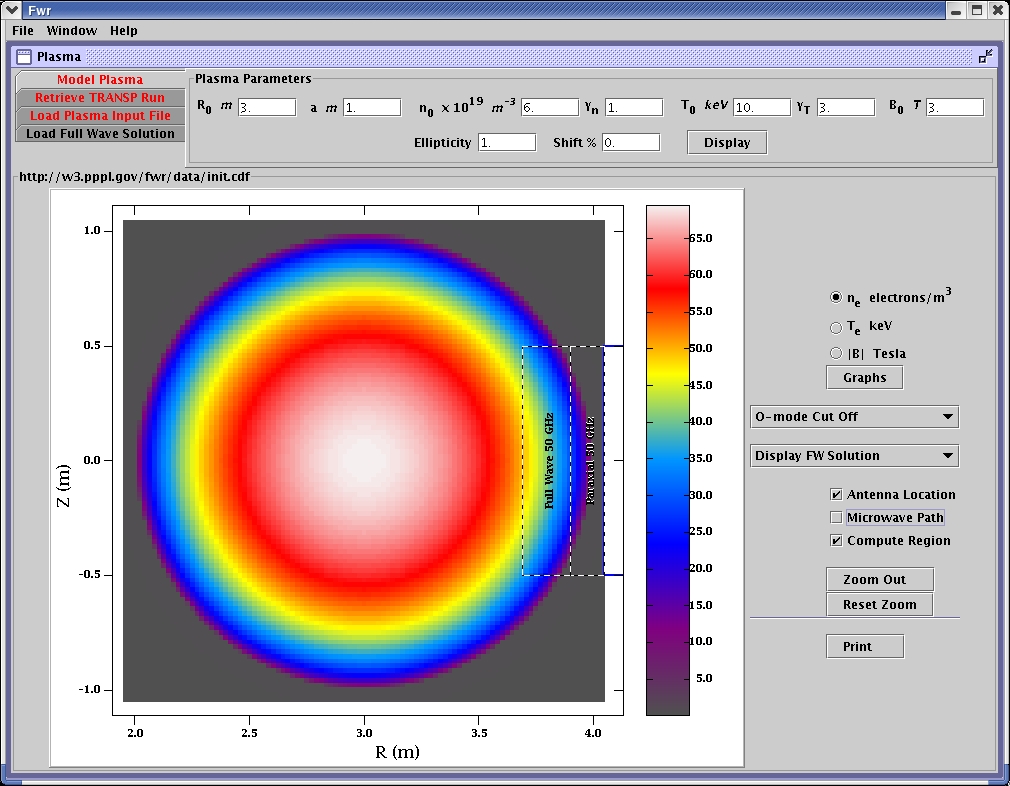
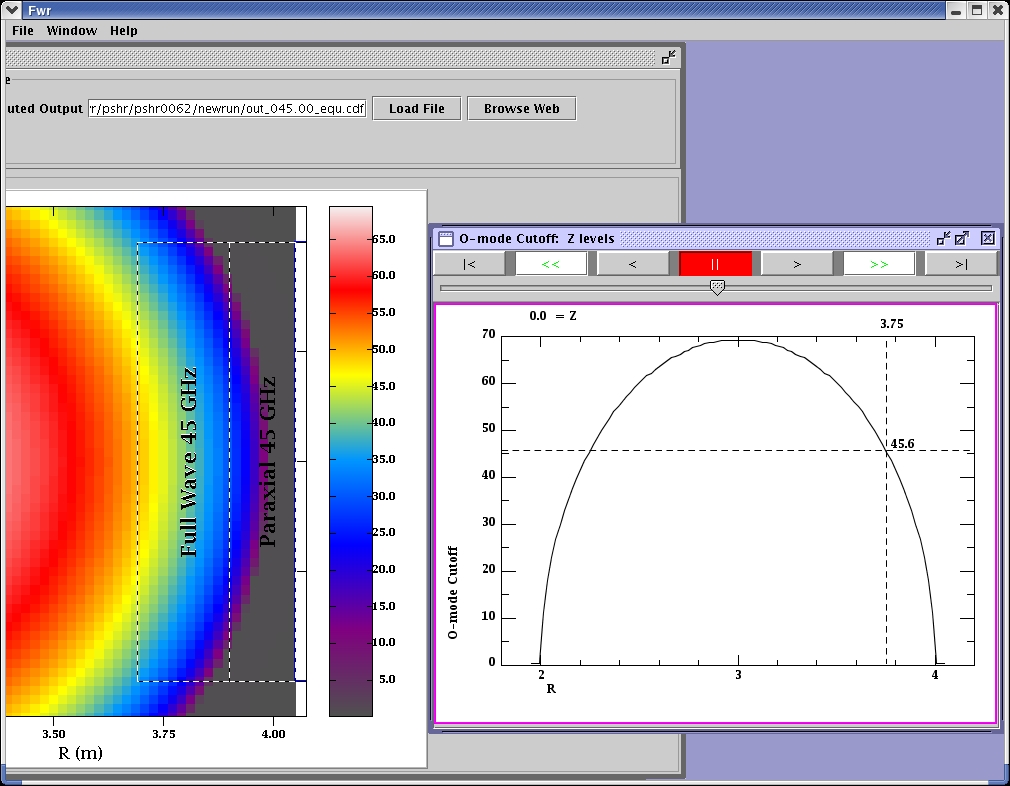
The O-mode cut off locations are calculated and color-coded for the frequency range.
The full wave solution is calculated and shown relative to the O-mode cutoff locations.
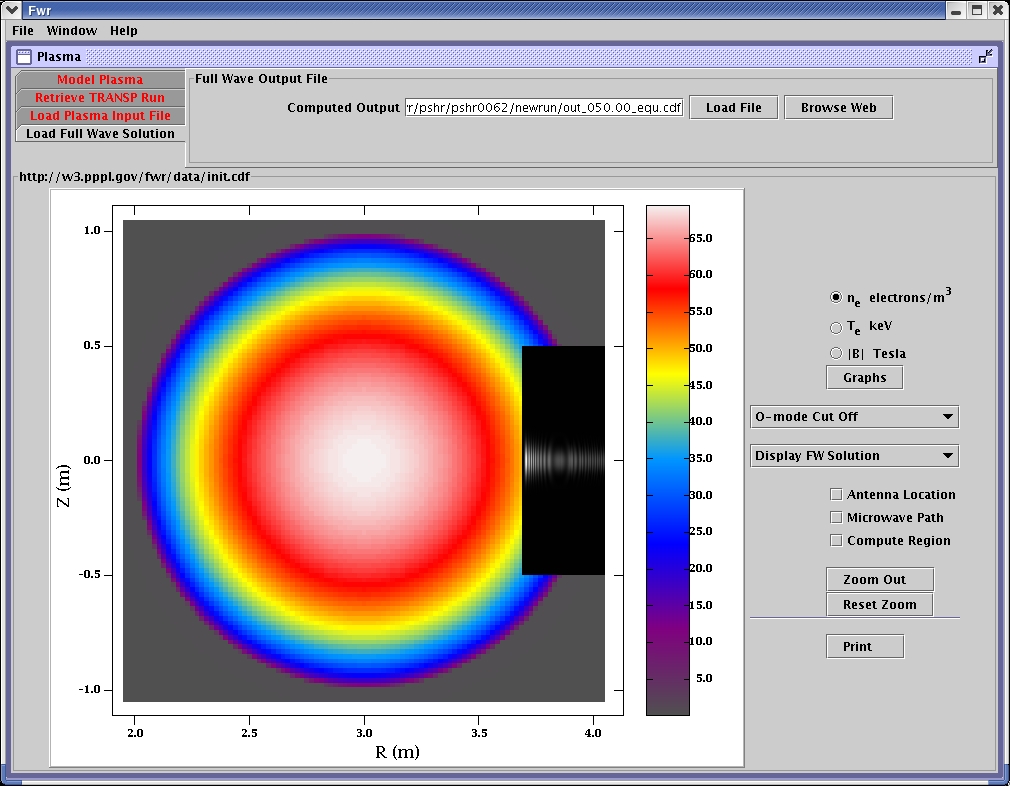
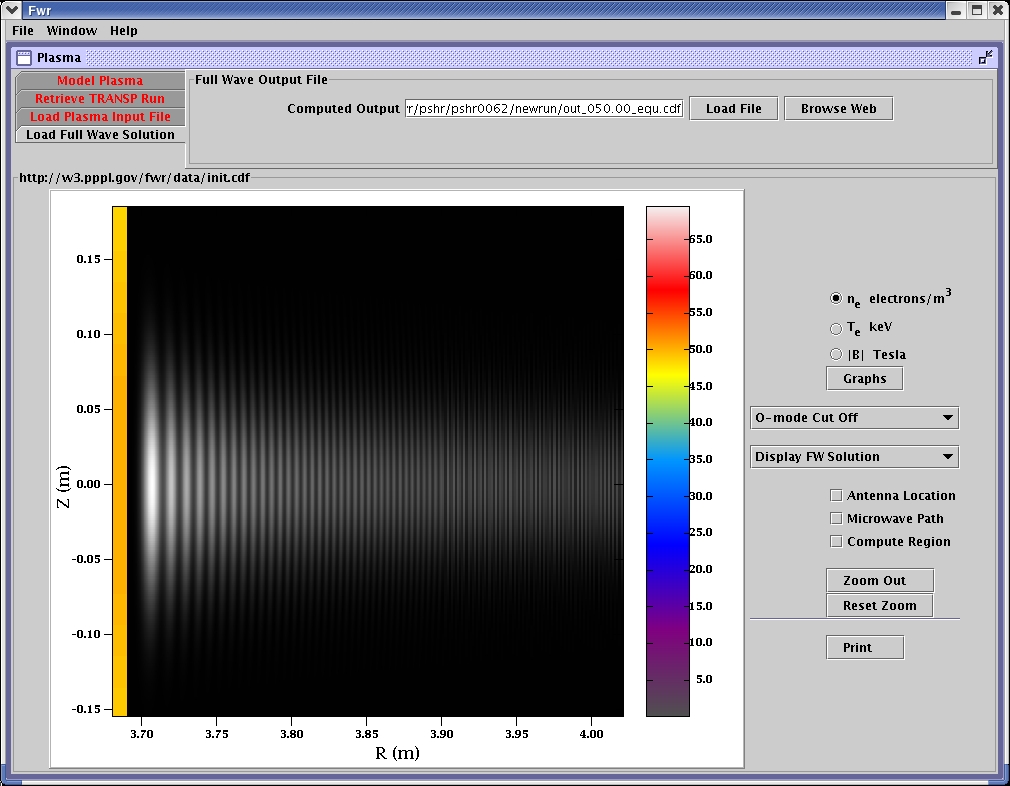
Zoom in view of full wave solution.
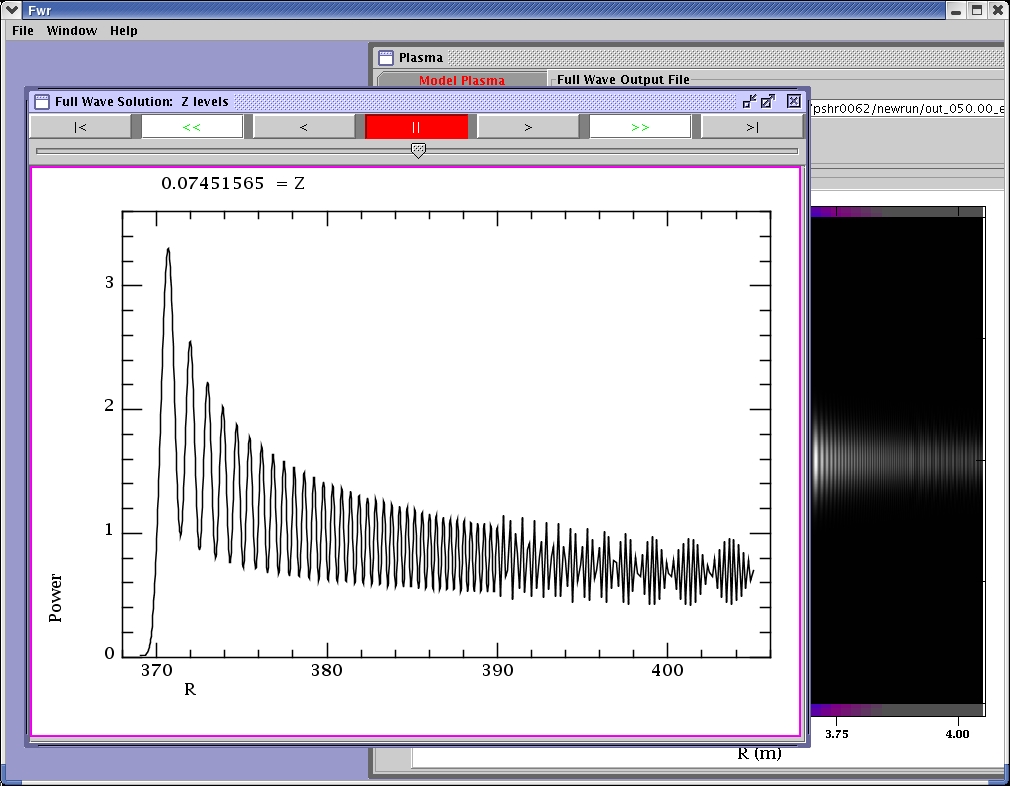
The intensity of the full wave solution is plotted in the graph.
A closer look at the output of the simulation for 50 GHz.
The O-mode cut off locations calculated and graphed for the range of frequencies.

The compute region and full wave solution for 45 GHz.
The compute region for 45 GHz was the same as for 50 GHz. The solution for 45 GHz cuts off farther from the center than for 50 GHz as predicted by the color-coded display of cut off locations. The visualization of the cut off locations guides the placement of the compute regions and the choice of frequencies.
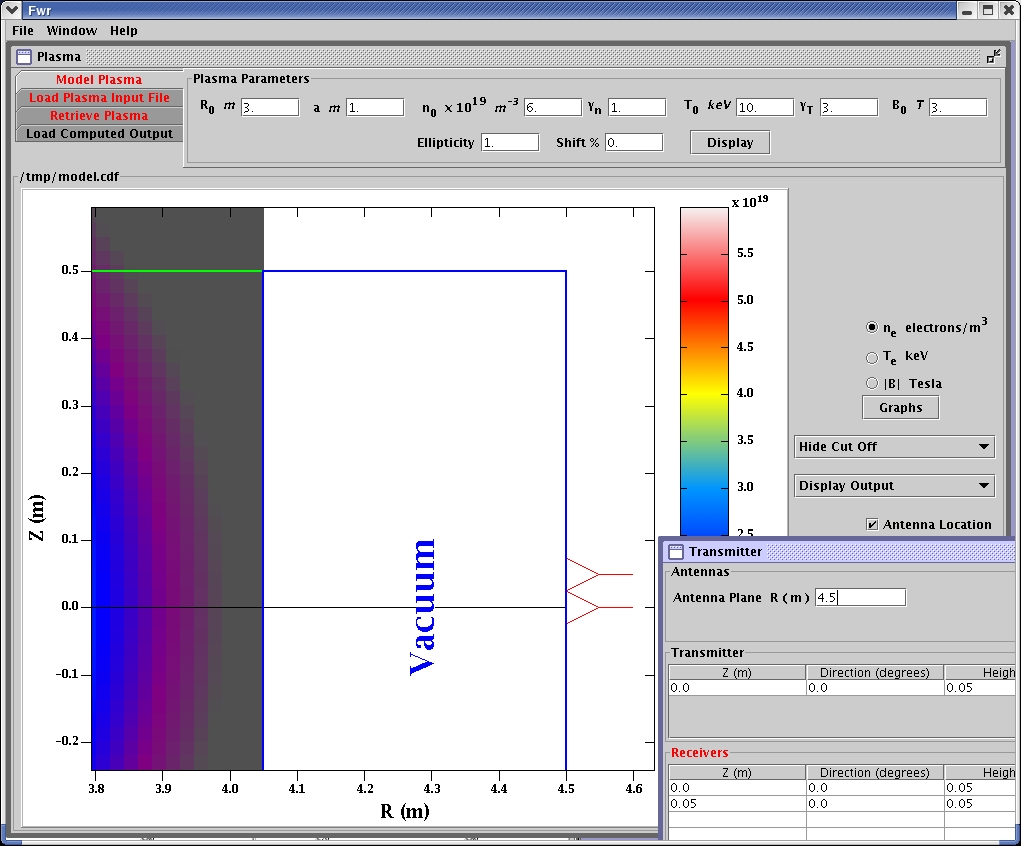
Receivers are positioned by the user.
Multiple runs are analyzed for coherence per receiver per frequency.
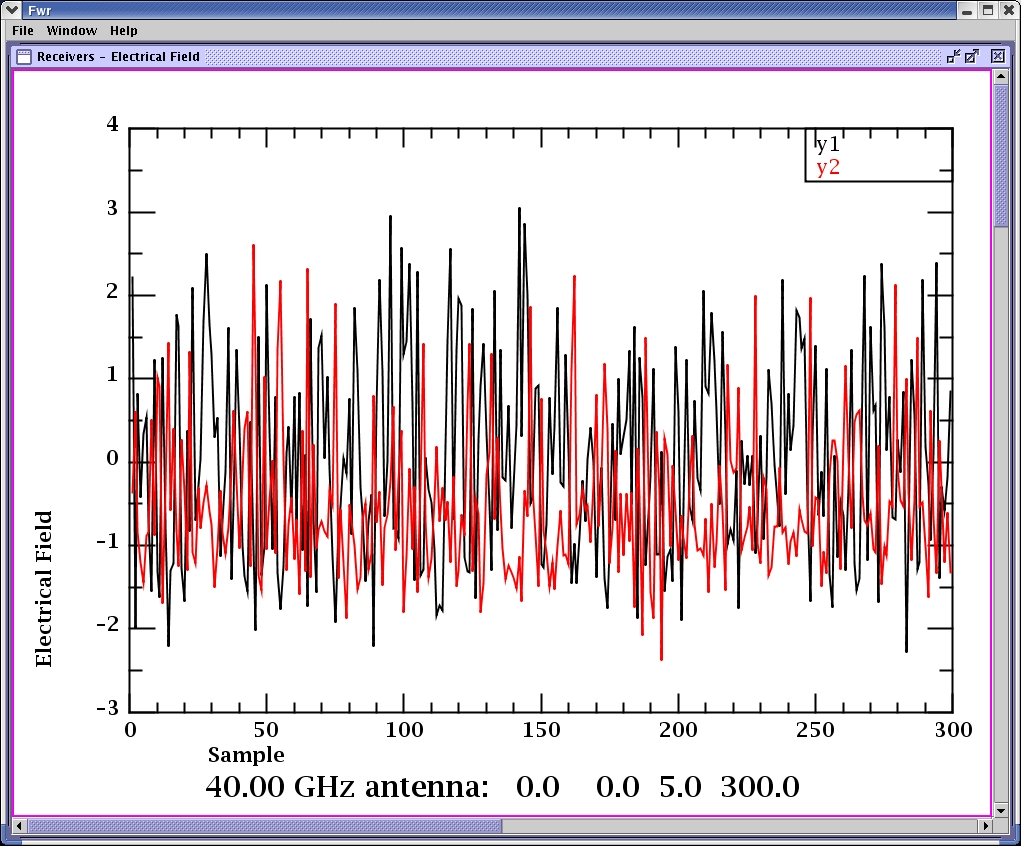
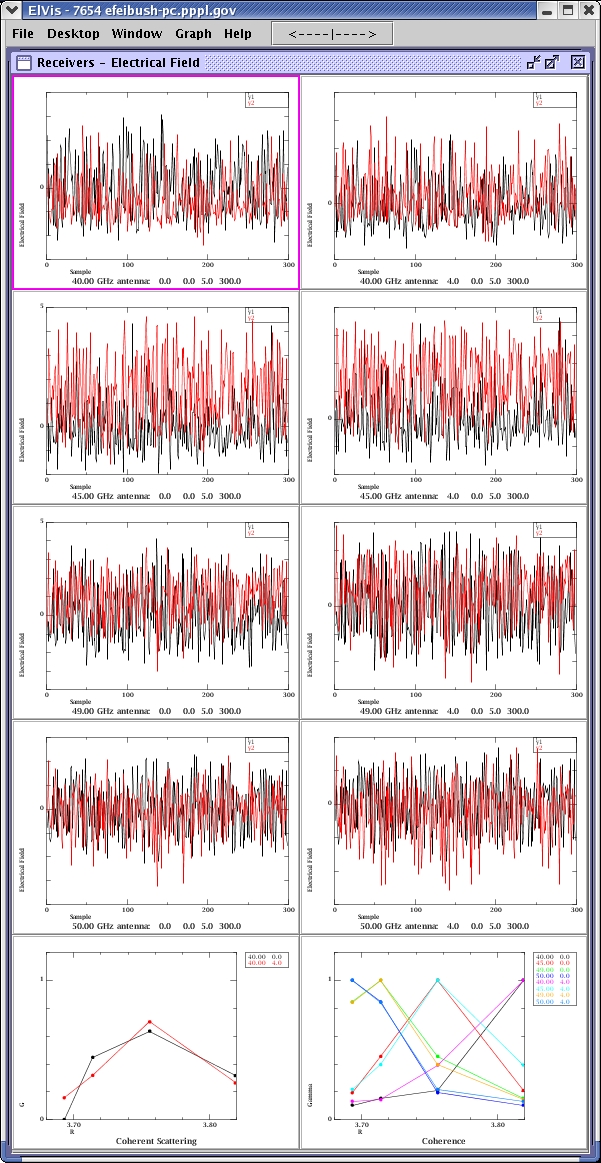
Each frequency received at each antenna is drawn in a separate graph.
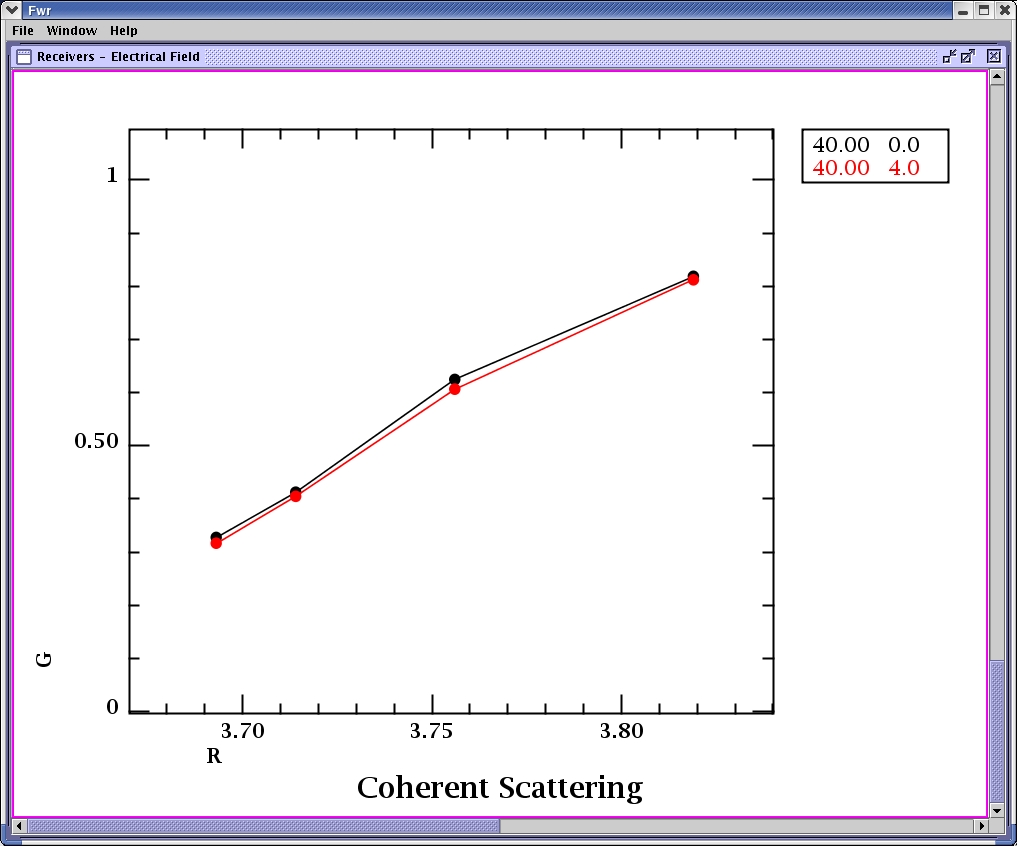
R values correspond to the cut off locations of the frequencies used in the simulation.
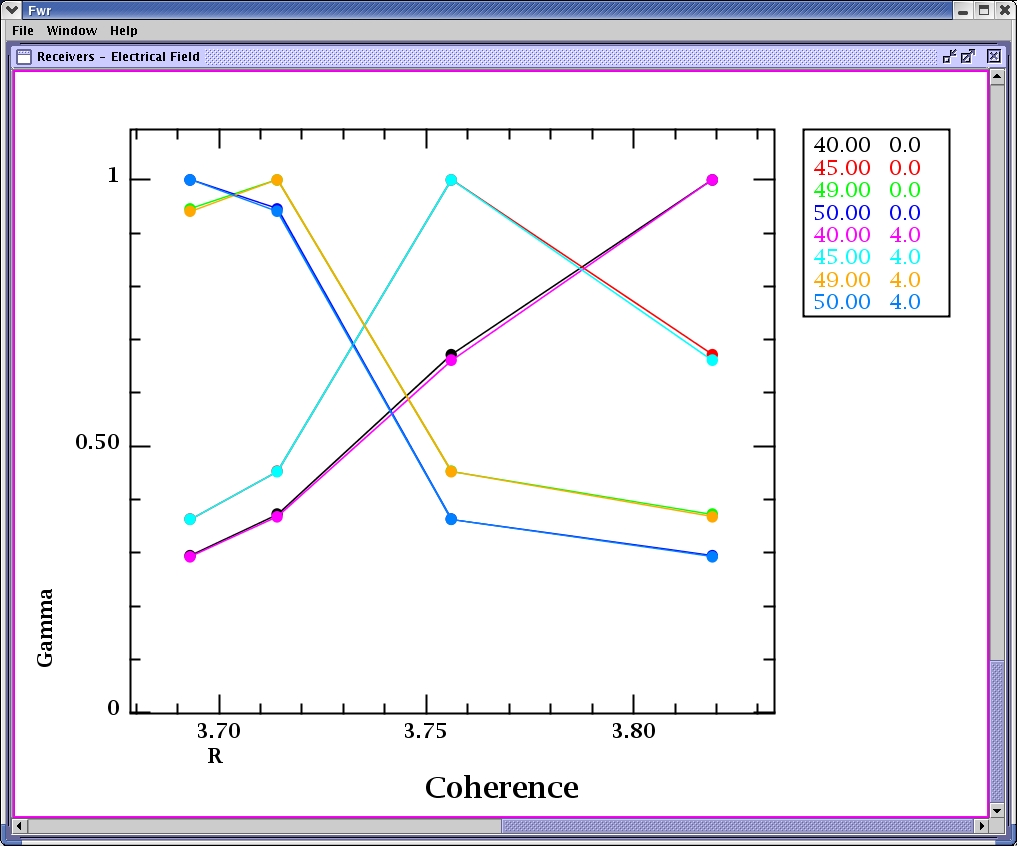
The data from all the runs is analyzed for coherence.
X mode cut off calculated for low range.
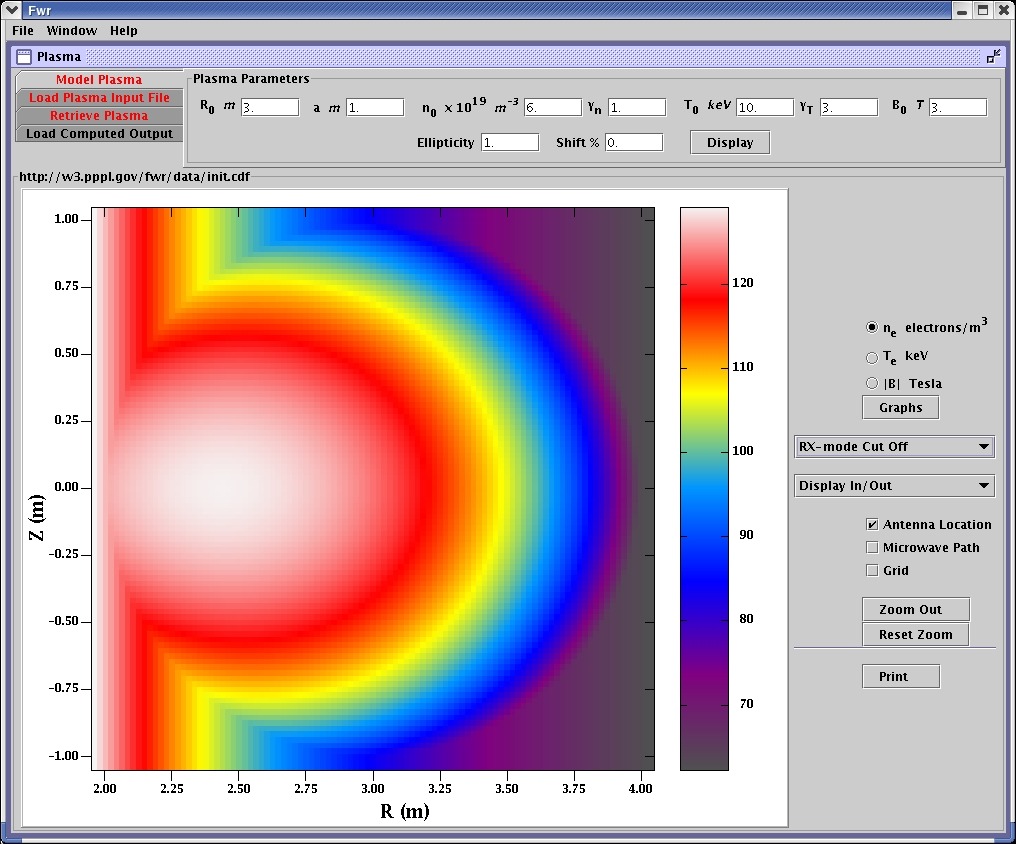
X mode cut off calculated for high range.
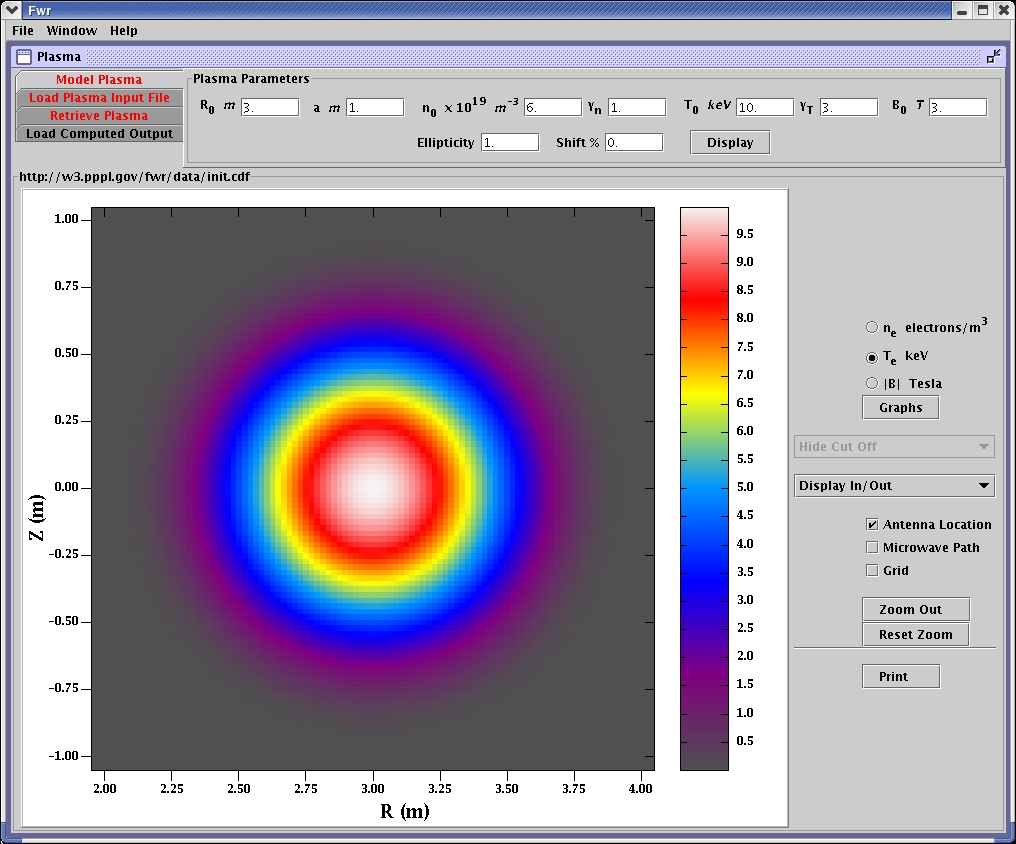
Electron temperature in the modeled plasma.
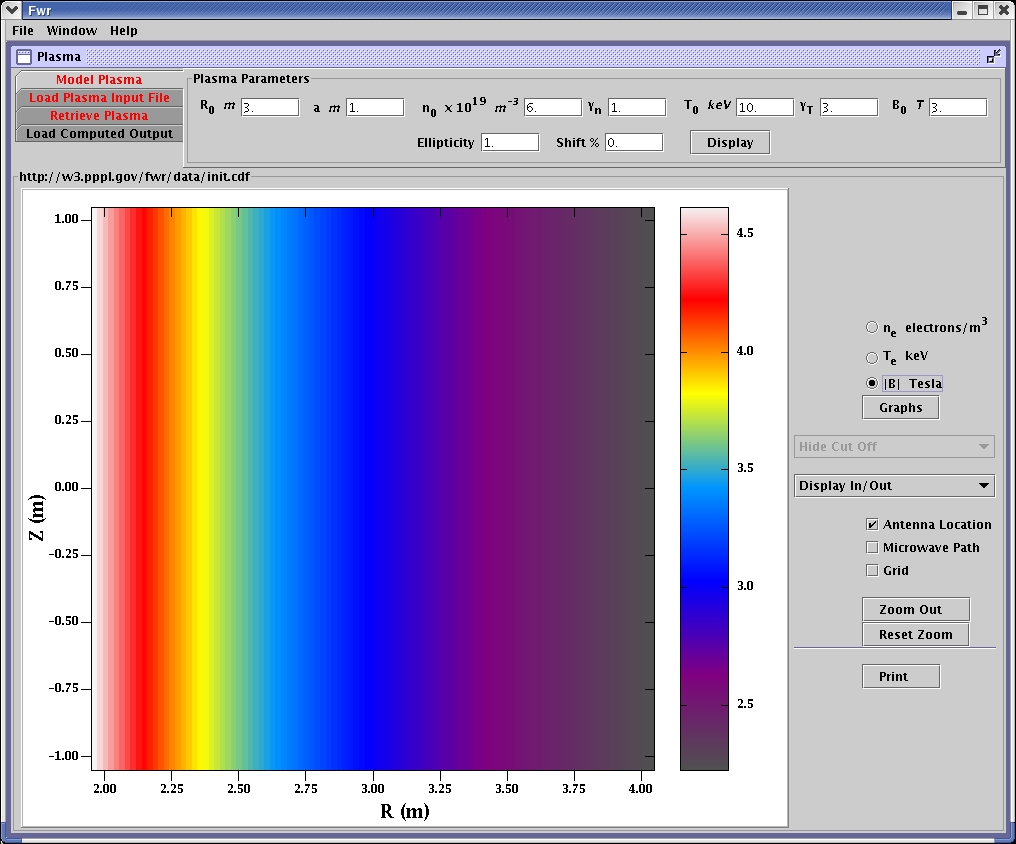
Magnetic field of the modeled plasma.
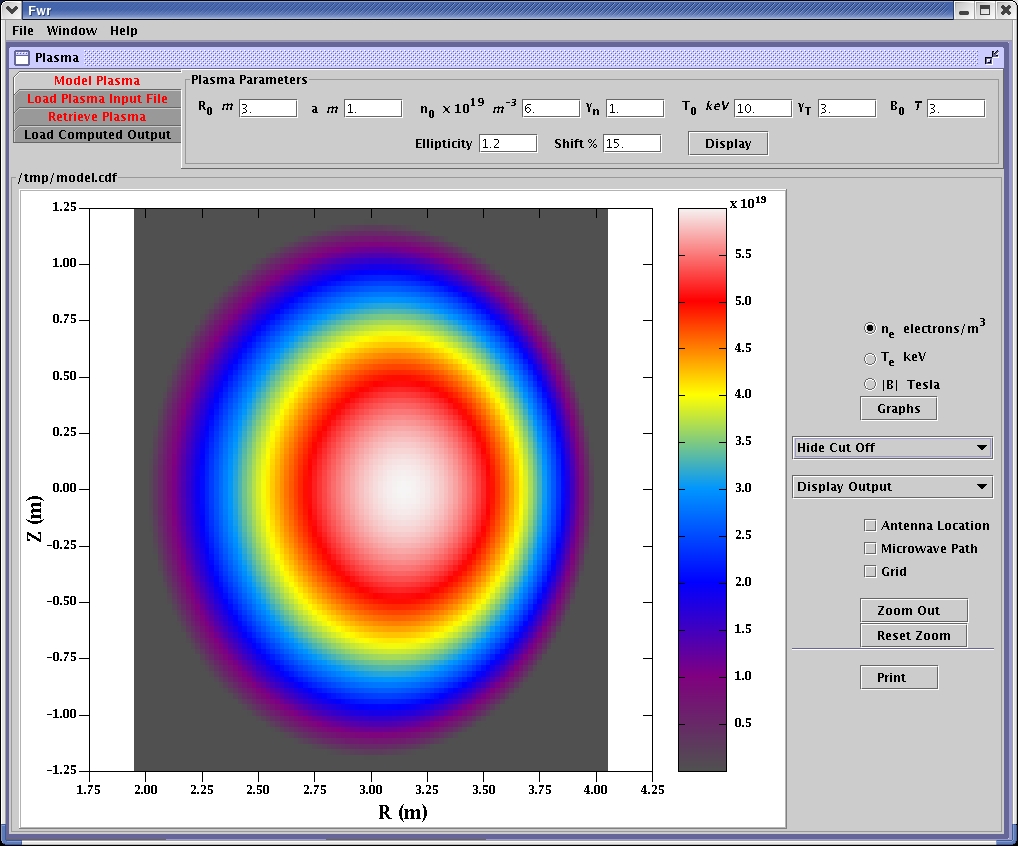
Elliptical and shifted plasma is modeled as input to reflectometer simulation.
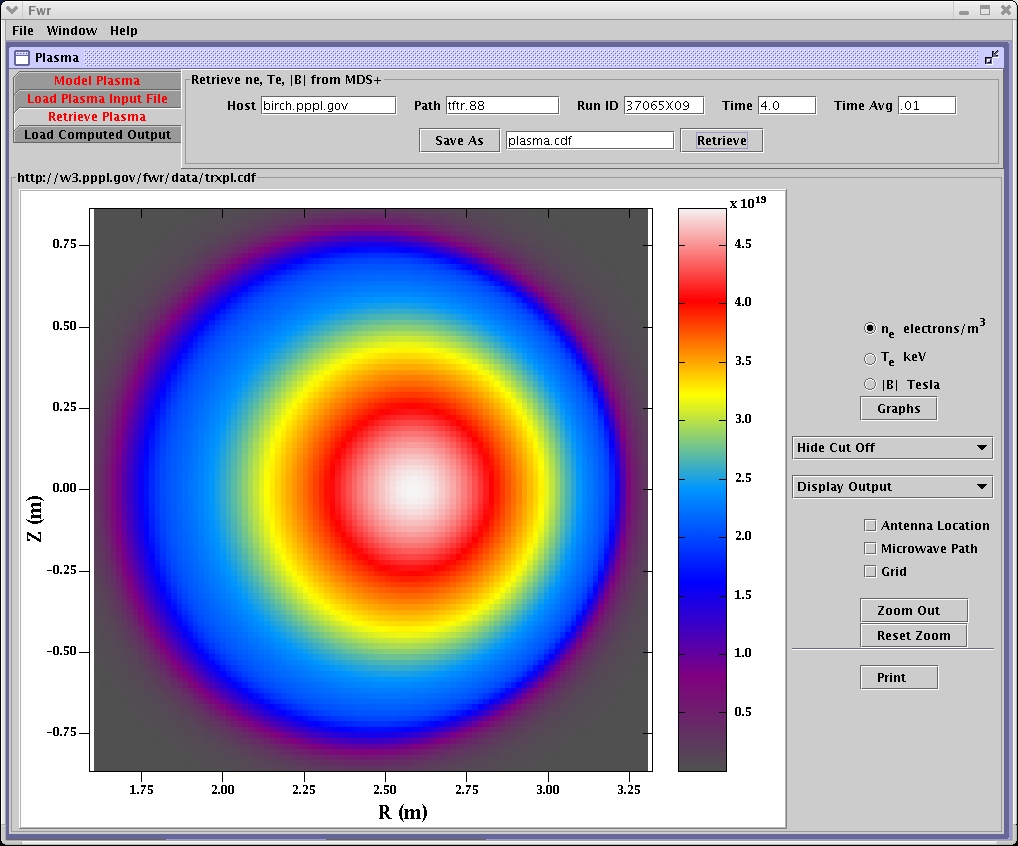
Data retrieved from a specific TRANSP run as input to the reflectometer simulation.
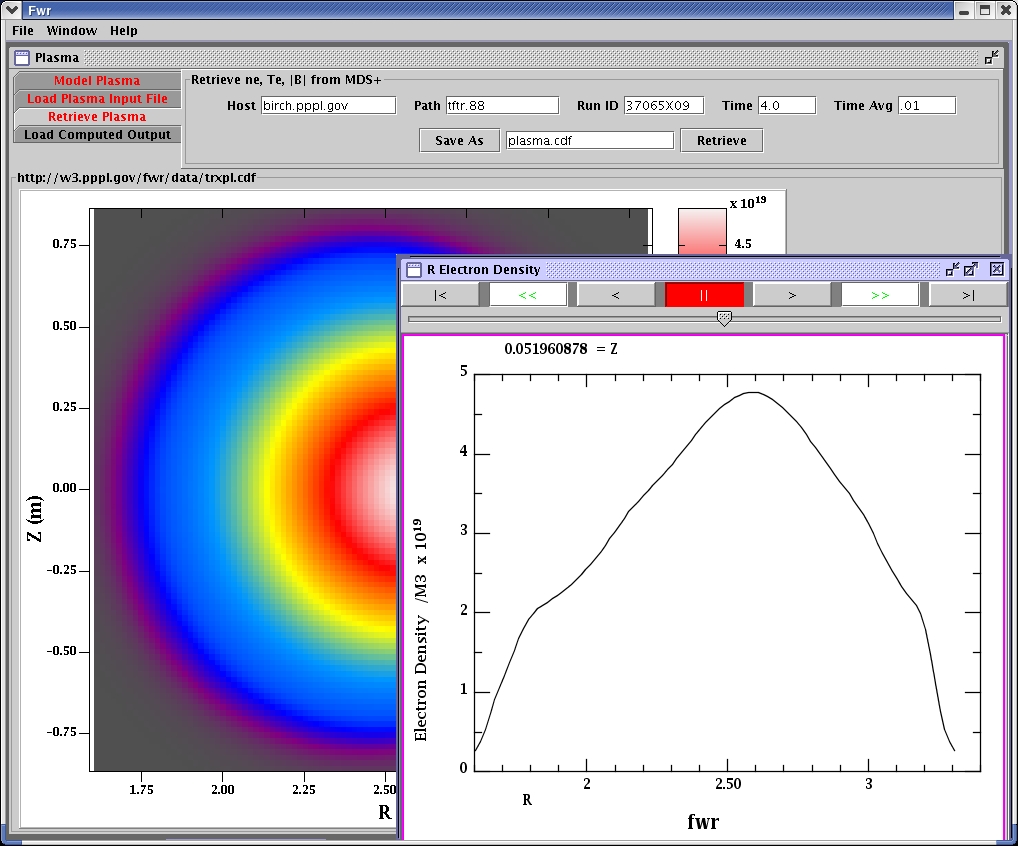
Graph of input electron density.