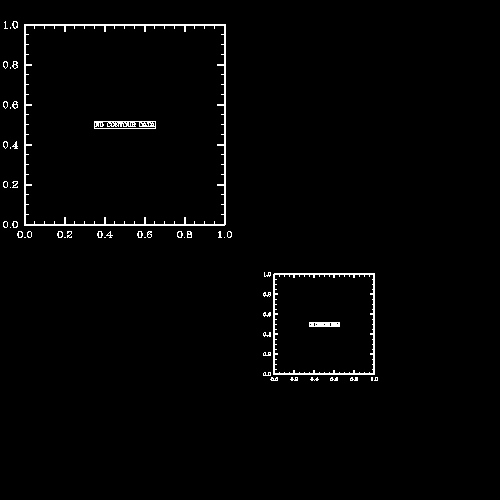
Basic example 2


This is an introductory example that shows how to specify viewport settings
to adjust the size and location of a plot and how to position multiple
plots on a single frame. This example demonstrates how to create the plot
using NCL, HLU C, and HLU FORTRAN library calls. The names of the example
codes that create this plot are basic02n.ncl, basic02c.c, and basic02f.f.

Discussion
This module discusses how to size and position an NCAR Graphics plot using
HLU C library calls, HLU FORTRAN library calls, and the NCAR Command
Language. The example produces two frames that are drawn into an X Window.
The first frame of the example shows how to set the viewport (an object's
bounding box) for an object using the vpXF, vpYF, vpWidthF, and vpHeightF
resources. vpXF and vpYF are resources that specify the location of the
left and top edge, respectively, of a viewport window. The values are
specified in Normalized Device Coordinates (NDCs), such that the
lower-left corner of the frame corresponds to the coordinate point (0,0),
and the upper-right corner corresponds to the coordinate point (1,1). The
vpWidthF and vpHeightF resources specify the width and height, respectively,
of the viewport. These values are also specified in NDCs.
The second frame of the example shows how to draw multiple plots in a
single frame. This is accomplished by drawing the first object, then
resetting the viewport to specify a different plot location and size, then
drawing the object again. These steps can be repeated multiple times to
draw multiple plots on a single frame.
This example does not use any data and is therefore more useful for
instruction rather than for creating useful graphical output. A detailed
discussion about how to create the plot appears in the comments of the
source code for the example.
The HLU C program that generates this plot is
called basic02c.c.
The HLU FORTRAN program that generates this plot is
called basic02f.f.
The HLU NCL program that generates this plot is
called basic02n.ncl.
No data is used in this plot.
There are three ways to produce this example: by using an NCL
script (basic02n.ncl), a C program (basic02c.c), or a FORTRAN
program (basic02f.f). The examples are installed in the following
locations:
- $NCARG_LIB/ncarg/nclex/basic/basic02n.ncl
- $NCARG_LIB/ncarg/hluex/basic/basic02c.c
- $NCARG_LIB/ncarg/hluex/basic/basic02f.f
You can copy this example and run it by typing
"ng4ex basic02n",
"ng4ex basic02c", or "ng4ex basic02f". A copy of the source file will be
placed in your current working directory. The source code will be
compiled (if appropriate) and automatically run for you.
Quick Start Guide Control Panel
NG4.1 Home, Index, Examples, Glossary, Feedback, QSG Contents, QSG WhereAmI?
$Revision: 1.9 $ $Date: 1999/03/23 18:28:09 $

