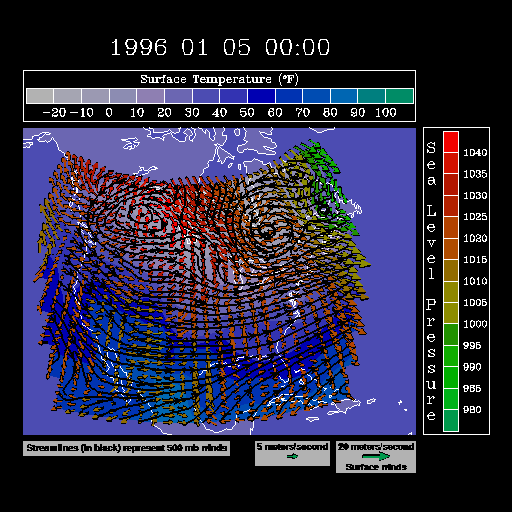
StreamlinePlot example 4


This StreamlinePlot example can be created using HLU C library calls,
HLU FORTRAN library calls, or NCL. It demonstrates how to overlay
streamlines on vectors over a map projection. The names of the source files
for this example are st04c.c, st04f.f, and st04n.ncl.

View this animation.
Discussion
This module discusses how to create this plot using using HLU function
calls or NCL. A resource file is included with this example, and it
is called st04.res.
This file is used to change the default resource settings for the
plot. Some of the StreamlinePlot line resources are tweaked in the
resource file to show how to make appearance changes.
This example shows a StreamlinePlot of 500 mb wind vector data
overlaid on a MapPlot. The streamlines are drawn over a VectorPlot of
surface winds colored by surface pressure that in turn is drawn over a
filled ContourPlot of surface temperature. Different intervals of the
"temp1" colormap are used to color the contour levels and the vectors.
The data represents 15 days of weather over North America in January,
1996. The data is extracted from NMC forcast data produced at 12 hour
intervals and converted to netcdf format by Unidata. Most of the time
steps in the files extracted from the original data are taken from the
0 and 6 hour forecast times. However, because some of the original
files were lost, certain time steps come from longer range
forcasts. Also, several steps had to be excluded from the frame set
because the data is defective. The result is that there is an apparent
discontinuity between some of the frames when the output is animated.
The HLU C program that generates this plot is
called st04c.c.
The HLU FORTRAN program that generates this plot is
called st04f.f.
The NCL script that generates this plot is
called st04n.ncl.
The data for this plot are from several netCDF files:
"Ustorm.cdf","Vstorm.cdf","Pstorm.cdf","Tstorm.cdf","U500storm.cdf",
and "V500storm.cdf".
The data files are located in your NCAR Graphics data directory in a
subdirectory called "cdf". You can get the name of the data directory
by typing "ncargpath data" at your shell prompt. If you have netCDF
installed on your system, then you can change directory to where the
netCDF files reside and type "ncdump -h file.cdf" to view the
header information for this data file.
This example can be created using a C program (st04c.c), a FORTRAN
program (st04f.f), or an NCL script (st04n.ncl). The examples are
installed in the following locations:
- $NCARG_LIB/ncarg/hluex/streamlineplot/st04c.c
- $NCARG_LIB/ncarg/hluex/streamlineplot/st04f.f
- $NCARG_LIB/ncarg/nclex/streamlineplot/st04n.ncl
The resource file for this example is located in:
- $NCARG_LIB/ncarg/resfiles/streamlineplot/st04.res
The netCDF data files are installed in the following directory:
- $NCARG_LIB/ncarg/data/cdf
You can copy this example and run it by typing "ng4ex st04c", "ng4ex
st04f", or "ng4ex st04n". A copy of the source file and resource file
will be placed in your current working directory. The source code will
be compiled and automatically run for you. You must have the netCDF library
installed on your system in order to compile the C or FORTRAN version
of this example.
Quick Start Guide Control Panel
NG4.1 Home, Index, Examples, Glossary, Feedback, QSG Contents, QSG WhereAmI?
$Revision: 1.9 $ $Date: 1999/03/23 19:00:57 $

