[Top] [Prev] [Next] [Bottom]
3.1 Curve Objects
To use Curve objects, you must import the Python module contained in file curve.py.
Instantiation
- from curve import *
- c1 = Curve ( <keylist>)
Description
A Curve object consists of the coordinates and other characteristics of a geometric curve. You use ``Curve'' to create one, and the other methods of the Curve class to make a new Curve out of the old one or change Curve characteristics. Here is a short description of the methods of the Curve class:
set: used to set one or more keyword arguments to new values. Warning--very little error checking is done; it may be possible to set keywords to conflicting values using this method.
new: reinitializes a Curve object for reuse. The arguments are the same as for Curve.
The keyword arguments are all of the form ``keyword = <value>''. Most are optional and will be assigned sensible values if omitted.
Keyword Arguments
The following keyword arguments can be specified for a Curve object:
- y, x, color, axis, label, type, marks, marker, width, hide
Descriptions of the keywords are as follows:
y = <sequence of floating point values> (required): the y coordinates of the curve.
x = <sequence of floating point values> (optional): the x coordinates of the curve. If not specified, y will be plotted versus its subscript range.
color = <value> where <value> is an integer from 0 to 63 (PyNarcisse) or 0 to 199 (PyGist) representing an entry in a color chart, or else a string giving a common color name. The common color names refer to colors on the default color card ``rainbowhls'' (PyNarcisse) or ``rainbow.gp'' (PyGist). The allowed names are "background", "foreground" (the default), "blue", "green", "yellow", "orange", "red", "purple", "cyan", "magenta", "gold", "yellowgreen", "orangered", "redorange", "black", and "white". The abbreviations "fg" and "bg" are also allowed. On this color card the numbers and their corresponding colors for PyNarcisse are roughly: 10-23: dark shading to light blue; 24-39: greens; 40-43: yellow to gold; 44-47: oranges; 48-57: reds; and 58-63: purples. PyGist shades will be similar but scaled from 0 to 199.
axis = "left" or "right" tells whether the left or right y axis will be assigned to this curve. (Narcisse allows two y axes with different scales, one on the left of the plot and one on the right; this option is not available in PyGist.)
label = <string> represents the label of this curve. In PyGist, the label will be a single character appearing periodically along the curve. In PyNarcisse, the label may be more than one character, and will appear opposite the right end of the curve.
type = <value> tells how the curve will be plotted: "line", "solid" (same as "line"), "step", "dash", "dashdot", "dashdotdot", "none", "+", "*", "o", "x", and "." are allowed. If the option is not available in a particular graphics package, a good guess will be substituted. If type = "none" and marks = 1, the plot will be a polymarker plot, if supported by the graphics. Note that because of disparities among graphics packages supported, you can specify plotting a curve pointwise with symbols like "+", "*", etc., either by use of the type variable or by using marks and markers in conjunction with type = "none".
marks = 0 or 1; select unadorned lines (0) or lines with occasional markers (1). PyNarcisse does not support this option. The markers default to letters of the alphabet, but can be changed by the marker keyword.
marker = character or integer value for character used to mark this curve if marks = 1. Special values '\1', '\2', '\3', '\4', and '\5' stand for point, plus, asterisk, circle, and cross, which sometimes look prettier than characters on some devices. ".", "+", "*", "o", and "x" are also allowed.
width = real number; specifies the width of a curve if this is supported by the graphics. 1.0 gives a finely drawn curve and is the default.
hide = 0 or 1; if set to 1, this curve will be hidden on the plot.
Examples
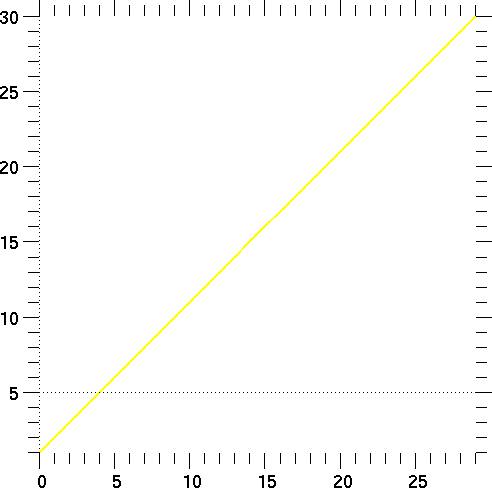
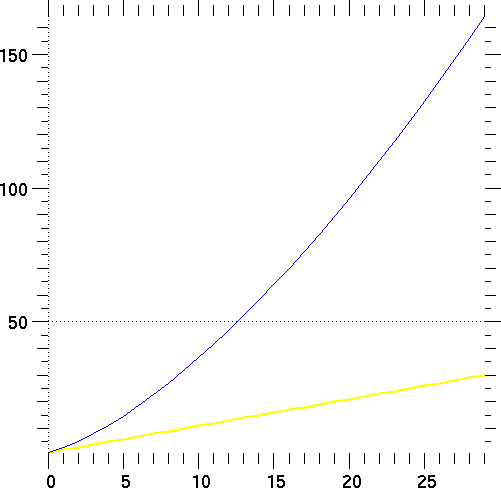
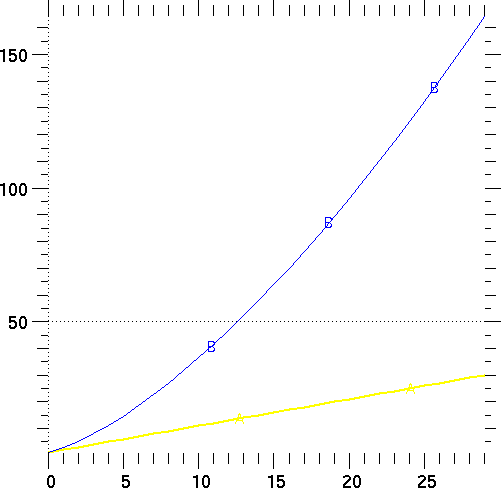
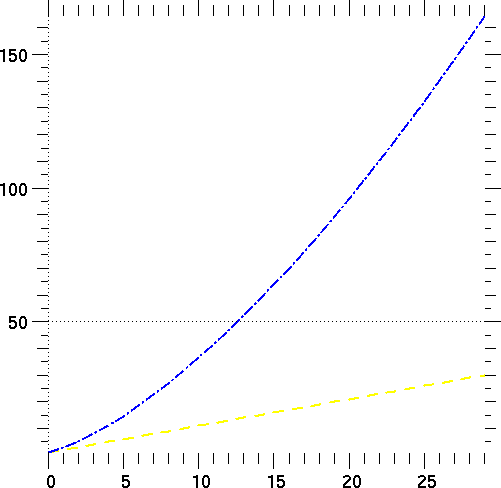
In the following example, two curves with different characteristics are created and plotted. The comments in the code explain what is going on. We use only the simplest (and minimal) properties of a Graph2d object for this example.
- from curve import *
- from graph2d import *
- # instantiate first Curve:
- c1 = Curve ( y = arange (1, kmax+1, typecode = Float) ,
- color = "yellow" , width = 4)
- # create a Graph2d containing this curve:
- g2 = Graph2d ( c1 )
- # plot this curve (Graph2d creates a default Plotter):
- g2.plot ( )

- # Create a second Curve:
- c2 = Curve (
- y = sqrt (arange (1, kmax+1, typecode = Float)**3) ,
- color = "blue")
- # Add it to the Graph:
- g2.add ( c2 )
- # Plot the two curves:
- g2.plot ( )

- # Change the two curves to have markers:
- c1.set (marks = 1, marker = "A")
- c2.set (marks = 1, marker = "B")
- # Replot with new characteristics:
- g2.plot ( )

- # change yet again:
- c1.set (marks = 0, width = 3.0, type = "dash")
- c2.set (marks = 0, width = 4.0, type = "dashdot")
- # Replot:
- g2.plot ( )

Note that the changes we made to curve instances c1 and c2 did not need to be transmitted to the Graph2d instance g2. g2 has references to c1 and c2, not copies of them; hence any changes made to the curves will be known to g2. This is characteristic of Python: it passes objects by reference rather than by value, which, particularly for large objects, saves a lot of copying overhead.
At this point we used only very simple Graph2d properties so as not to distract from the fact that we are currently emphasizing curves. For thorough discussions and examples of Graph2d, see Section 5.1 "Graph2d Objects" on page 75.
[Top] [Prev] [Next] [Bottom]
support@icf.llnl.gov
Copyright © 1997,Regents of the University of California. All rights
reserved.


