[Top] [Prev] [Next] [Bottom]
2.1 PyGist 2-D Graphics
In two dimensions, PyGist supplies functions to plot curves, meshes (with various combinations of contours, filled mesh cells, and vector fields on the mesh, with color-filled contours in the future), sets of filled polygons, cell arrays, sets of disjoint lines, text strings, and a title. These are all provided by the Python module gist.py.
We will show a couple of simple examples below to give the reader a flavor of the interface.
Example 1
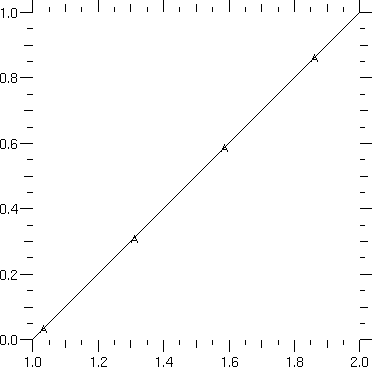
In the first example we simply plot a straight line from (1, 0) to (2, 1). Note that only two coordinates are specified for y; x is not specified. In such a case, the values of x default to the integers from 1 to len (y).
- from gist import * # Put plot functions in name space.
- pldefault (marks = 1, width = 0, type = 1, style = "work.gs",
- dpi = 100) # Set some defaults.
- winkill (0) # Kill any existing window.
- window (0, wait = 1, dpi = 75)
- plg ( [0, 1]) # The first positional argument is y.

As can be deduced from this example, most PyGist function calls can be augmented with a number of optional keyword arguments. These can (usually) be supplied in any order, and each is of the form keyword=value. Throughout this manual, a list of the available keywords for a function is given with the description of the function.
Example 2
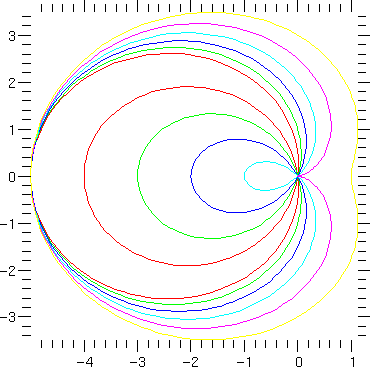
The next example computes and plots a set of nested cardioids in the primary and secondary colors.
- fma()
- x = 2 * pi * arange (200, typecode = Float) / 199.0
- for i in range (1, 7):
- r = 0.5 * i - (5 - 0.5 * i) * cos (x)
- s = 'curve ' + \Qi\Q #Backticks produce something printable.
- plg (r * sin (x), r * cos (x), marks = 0, color = - 4 - i,
- legend = s) # Curves unmarked, in colors.
- # (See next page.)

[Top] [Prev] [Next] [Bottom]
support@icf.llnl.gov
Copyright © 1997,Regents of the University of California. All rights
reserved.

