ElVis
Scientific Graphics for
Visualization and Monitoring
ElVis
displays
graphs of data from a variety of sources. Users can
explore the data and output publication quality PostScript
and PDF files. ElVis can display and animate several
graph windows simultaneously. The software is
written in Java for portability. Long running
simulations can be monitored by running ElVis and
selecting data from its internal browser.
ElVis is developed by Eliot Feibush
at PPPL.
ElVis
Launcher
Download and run this
launcher program to install ElVis, check for new versions,
and run ElVis with increased memory. This Java
program also checks for the right version of Java on your
computer. Initially, it installs the latest version
of ElVis in the "Elvis" directory in your home
directory. The launcher then runs ElVis with the
amount of memory you specify. Subsequently, when you
run the launcher, it checks to see if a new version of
ElVis is available. The latest version is dated
9/20/2017. The version date is shown in the title
bar. Update information is available from the
toolbar menu under Help-->What's new.
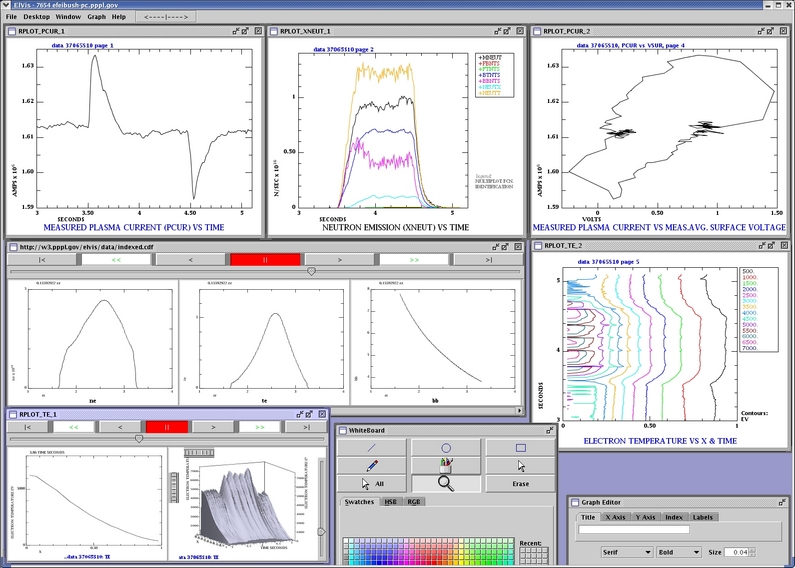
Integration with RPLOT
ElVis can display graphs generated by RPLOT. Go to Running RPLOT with ElVis for instructions and examples.
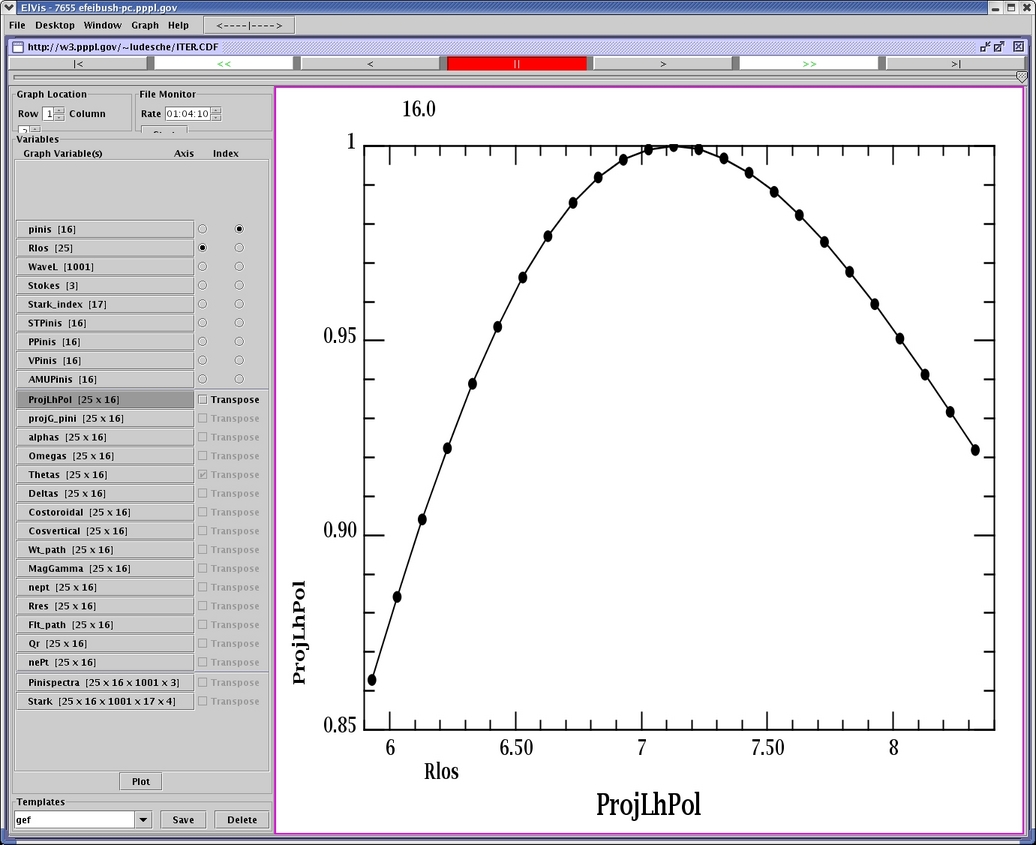
Getting Started with the Graphical Interface
You can display a sample graph and interact with it. Go to File-->Browse URL. This brings up a file selection box. Click on xneut.cdf to load a typical graph. Try some interactions:
Zoom - click in the graph and drag the selection rectangle to zoom in on the data. You can also move the cursor into the graph and type the '=' key to zoom in or the '-' key to zoom out. Type the letter 'a' to reset.
Resize - hold down mouse button 3 (MB3) to get the pop-up menu. Select Max & Fill to enlarge the graph window. Select Restore to return the window to its original size.
|< Jump to the lowest index.
<< Sequentially display the datasets by decrementing the index.
< Decrement the index by 1.
|| Stop the animation.
> Increment the index by 1.
>> Sequentially display the datasets by incrementing the index.
>| Jump to the highest index.