Sept 4, 1997
I have two results to report this week:
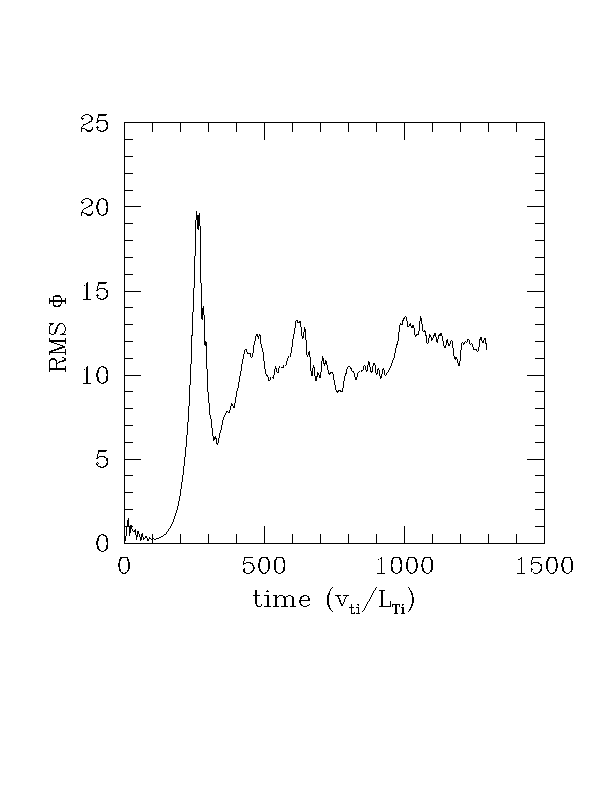
1. Plots of RMS Phi vs. time to compare with Andris's results.
2. Chi vs. epsilon (r/R) scaling to compare with Andris's IAEA epsilon scaling. (More recent results can also be found here--9/15/97.)
--------------------------------
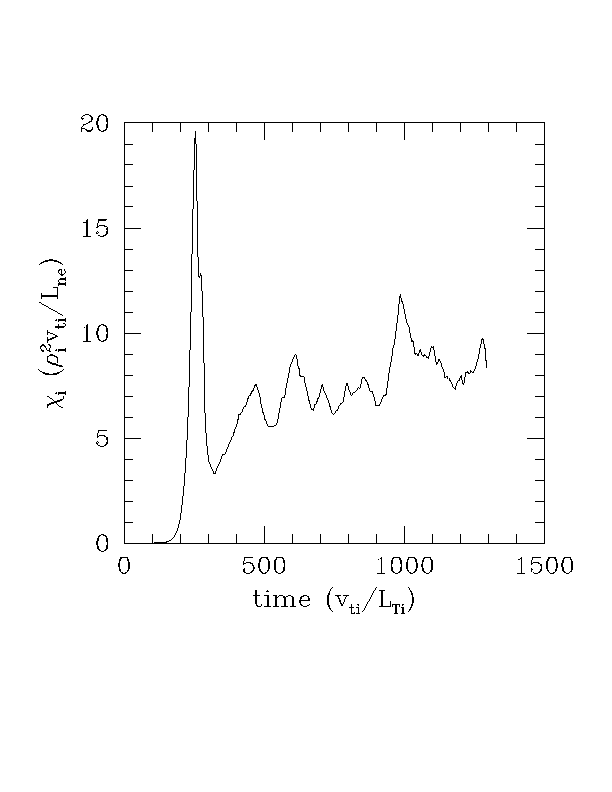
1. Below are plots of chi_i and the RMS Phi (volume averaged) for the base case parameters.


| DIII-D base case: | k_theta,max | gamma | omega_r | R/L_Tcrit | chi_i | phi^2 | |
|---|---|---|---|---|---|---|---|
| GF Gryffin | 8 | 12 | |||||
| GK particle | 2.4 | 10 |
-----------------------------
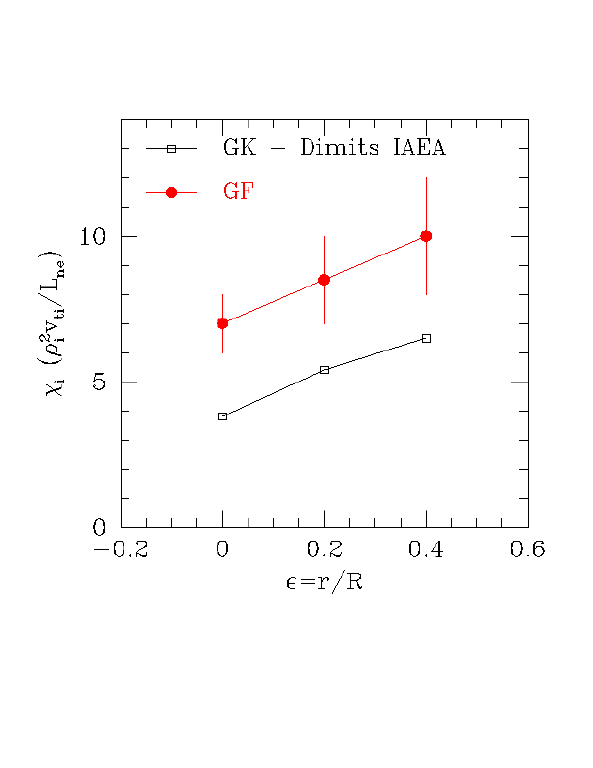
2. As discussed previously, the epsilon (r/R) scaling of the comparison between GF and GK results can test the importance of the Hinton-Rosenbluth effect. Below I have done a set of runs to compare with Andris's IAEA paper, which has an epsilon scan in Figure 2. The time histories are shown below:

These runs used our "4+2" equations and a parallel box length of -pi to pi, the same as in the GK particle runs. We typically see a 40% increase with longer boxes, but haven't run these particular cases with longer boxes.
Because with larger epsilon energy goes to longer wavelengths, the boxes I used are not very good for eps=0.2 and eps=0.4. This is why these runs haven't settled down too well yet. The following is a comparison of Andris's scaling and these runs, with error bars on the GF points since the runs aren't totally saturated.

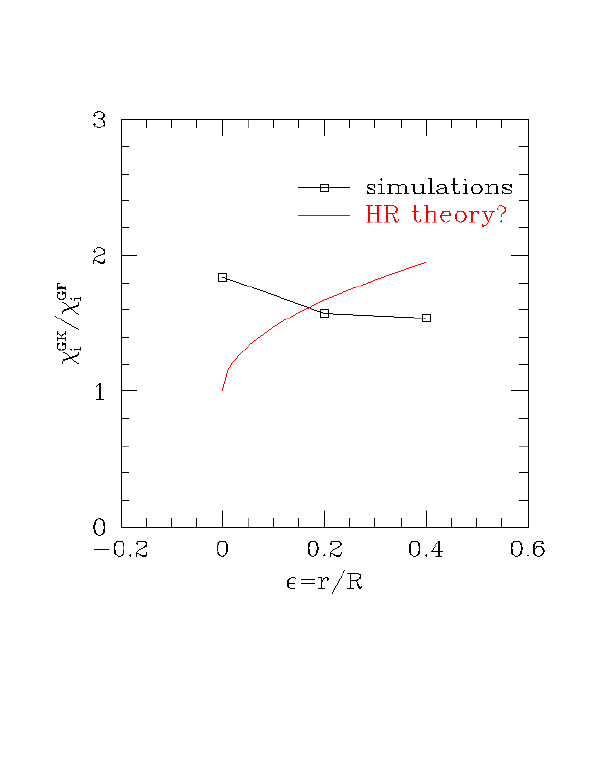
The trend is pretty clear: the difference between GF and GK does not scale strongly with epsilon. If the Hinton-Rosenbluth effect were the dominant cause of the difference between the GF and GK results, chi_GF/chi_GK would scale something like 1+const*sqrt(eps), as shown below in red.

--Mike
Back to index of cyclone pages
Back to Mike Beer's home page