Previous Chapter LLUs Home Next Chapter IndexNCAR Graphics offers several methods for drawing points and markers on a plot. You can create a single marker or a series of markers at any location and draw lines between them. You can also create filled circular dots with any size and color. The following modules show you how to draw a variety of points and markers, connect them with lines, and set color options using GKS, SPPS, and NCAR Graphics utilities.

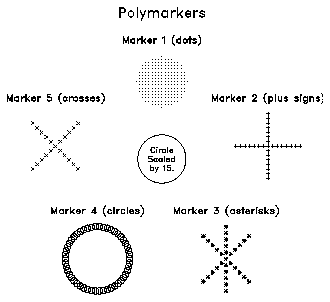
This module discusses how to draw, scale, and color a polymarker using GKS routines.
1  CALL GSMK(4)
2  CALL GSPMCI(1)
3  CALL GSMKSC(2.)
4  CALL GPM(JL,XM1,YM1)
5  CALL PCSETI('CD',1)
6  CALL GSPLCI(1)
7  CALL PLCHHQ(X0,Y0+R+.05,'Marker 4 (circles)',.018,0.,0.)
CALL GPM (JL, XM1, YM1)
The fgkgpm.f code segment is responsible for drawing and labeling the circle of linked circles (Marker 4) in the lower left corner of the output plot.
Line 1 sets the polymarker type to a circle. GSMK takes an integer argument, which specifies the marker type. Valid values are 1 (dot), 2 (plus), 3 (asterisk), 4 (circle), and 5 (cross).
Line 2 specifies the color index in the color table that is used to color the polymarkers. The color table was set up earlier in the code using the GSCR routine.
Line 3 calls the GSMKSC procedure that scales the marker by a factor of two. The argument to GSMKSC must be a real value greater than or equal to 0.
Line 4 calls GPM and draws a series of circles. JL is the number of circles drawn and the XM1 and YM1 arrays specify the X and Y world coordinates of each marker. These coordinates were set prior to entering this code segment.
Line 5 selects the duplex character set.
Line 6 sets the polyline color index that is used for coloring text.
Line 7 draws the text above the set of circle polymarkers.
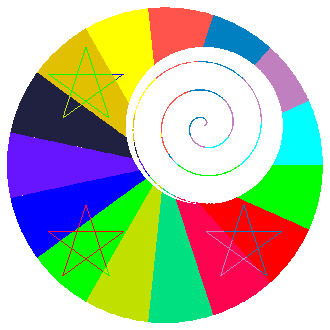
This module discusses how to create and color points using the SPPS routine POINT.
1       CALL SET (.01,.99,.01,.99,-1.,1.,-1.,1.,1)
2       DO 108 ING=1,1500
3              RAD=REAL(ING)/1000.
4              ANG=DTR*REAL(ING-1)
5              XCD=.25+.5*RAD*COS(ANG)
6              YCD=.25+.5*RAD*SIN(ANG)
7              CALL SFLUSH
8              CALL GSPLCI(IT1)
9              CALL POINT (XCD,YCD)
10 108  CONTINUE
11      CALL FRAME
CALL POINT (PX, PY)
Line 1 sets the mapping between the fractional coordinate system and the user coordinate system. The coordinates used by the POINT routine are user coordinates.
Line 2 enters a loop that calculates the coordinates for the points on the spiral and calls POINT for each new coordinate calculated.
Lines 3 through 6 calculate and save the coordinates for the spiral function in the XCD and YCD variables.
Line 7 flushes the output buffer. Because of buffering, objects created by a mixture of calls to SPPS routines and GKS routines may be drawn in the wrong order. Flushing the buffer avoids this problem.
Line 8 sets the color of the dot. Notice that to set point color using the POINT routines, you use the polyline color index and not the polymarker color index. This is because of the way points are drawn by POINT. In this example segment, the code for determining the value of IT1 (and therefore the color) was left out because of space considerations. For a complete example, see the source file, fsppoint.f.
Line 9 draws a single dot at the XCD, YCD coordinates.
Line 10 ends the loop.
Line 11 closes the picture.
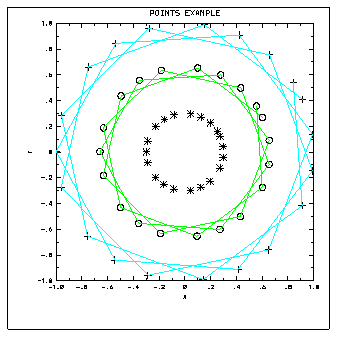
This module demonstrates how to create a series of markers, connect them with line segments, and select color options.
1  CALL AGSETI ('SET.',-1)
2  CALL EZXY (XDRA,YDRA,NPTS,'POINTS EXAMPLE$')
3  CALL GSMKSC(2.0)
4  CALL GSPLCI(7)
5  CALL GSLWSC(3.0)
6  CALL POINTS (XDRA,YDRA,NPTS,-2,1)
7  CALL GSPLCI(9)
8  CALL POINTS (X2DRA,Y2DRA,NPTS,-4,1)
9  CALL POINTS (X3DRA,Y3DRA,NPTS,-3,0)
CALL POINTS (PX, PY, NP, IC, IL)
Line 1 of the fsppoints.f code segment suppresses the drawing of curves by the EZXY routine.
Line 2 draws the background using EZXY.
Line 3 scales the size of the polymarkers up by a factor of 2.0.
Line 4 sets the color of the polyline to color table index 7. The color table was set up prior to entering the code with the GSCR routine.
Line 5 sets the width of the polyline to 3.
Line 6 draws the outer group of plus signs and connects them with line segments.
Line 7 sets the color of the polyline to color table index 9.
Line 8 draws the middle group of circles and connects them with line segments.
Line 9 draws the inner group of asterisks. These markers are not connected by line segments because the last argument in the POINTS call is 0.
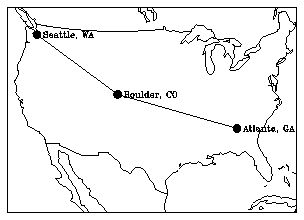
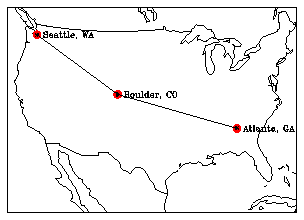
This module demonstrates how to draw filled circles with NGDOTS and adjust their size and color.
1       CALL MAPSTC ('OU - OUTLINE DATASET SELECTOR',OUTLN)
2       CALL MAPROJ (PROJ,PLAT,PLON,ROTA)
3       CALL MAPSET (JLIM,PLIM1,PLIM2,PLIM3,PLIM4)
4       CALL MAPSTR ('GR',0.)
5       CALL MAPDRW
6       DO 100 I=1,NUMSTS
7              CALL MAPTRA(LAT(I),LON(I),X,Y)
8              XCOOR(I) = X
9              YCOOR(I) = Y
10             CALL PLCHHQ (X+.015,Y,CITY(I),.015, 0., -1.)
11             INDICE = I
12 100  CONTINUE
13      IF (XCOOR(INDICE).NE.1.E12) THEN
14              CALL NGDOTS (XCOOR,YCOOR,NUMSTS,.02,15)
15      ENDIF
16      CALL POINTS (XCOOR, YCOOR, NUMSTS, -3, 1)
CALL NGDOTS (X, Y, NUM, SIZE, ICOLOR)
Line 1 of the fngngdts.f code segment sets the type of map outlines.
Line 2 sets the map projection.
Line 3 sets the map limits.
Line 4 turns off the grid lines in the map.
Line 5 draws the map.
Lines 6 through 12 define a loop that transforms the map coordinates to world coordinates for each of the three cities and plots a label (the city name) at each position.
Line 13 tests if the transformation resulted in valid coordinates.
Line 14 draws NUMSTS dots with a size of .02 and a color mapped to the color table entry 15.
Line 16 draws asterisks on top of the filled dots and connects them with line segments.
Previous Chapter LLUs Home Next Chapter Index