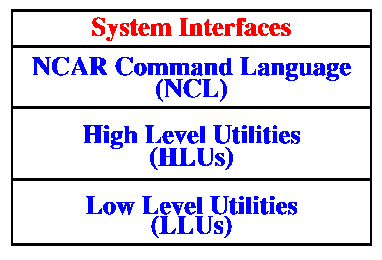

The NCAR Graphics software is logically divided into several system interfaces: the NCAR Command Language (NCL) interpreter, the High Level Utilities (HLUs), and the Low Level Utilities (LLUs). Each of these components represents a user interface to the software.
Much of the new NCAR Graphics software is built upon the LLUs, which comprise the traditional NCAR Graphics package. Developers can build an NCAR Graphics application by making calls to the NCAR Graphics Fortran and C low level libraries. This interface consists of over two dozen utilities for contouring, mapping, drawing field flows, drawing surfaces, drawing histograms, drawing XY plots, labeling, and more. Currently, this interface contains the richest set of functionality of all the interfaces.
The HLUs are an object-oriented Fortran and C interface that provide a consistent programmatic interface to the software. HLUs manage the graphics state of NCAR Graphics on your behalf, making all function calls to the traditional software in the correct order and managing all internal work arrays and common blocks. This design makes it unnecessary for you to understand and control most of the low-level implementation details of the traditional software. By reducing the complexity of traditional NCAR Graphics, the HLUs make it easier for you to learn the software at the programming level. New users who want to develop NCAR Graphics applications are encouraged to start with this interface.
The NCL is a user interface that provides the option of creating plots and manipulating arrays of data from the command line using an interpreted language rather than from within a compiled Fortran or C program. NCL allows you to import and export data in a variety of formats (ascii, binary, HDF, netCDF) and to manipulate that data with the NCL commands. Interactive data manipulation includes selecting region-of-interest data, thinning data, interpolating irregular grids to regular grids, performing curve fits, removing corrupted data, and performing useful transformations. You will also be able to customize the methods NCL uses to ingest and manipulate data. As a tool for specifying visualizations, NCL allows you to generate 1D, 2D, and 3D plots in many styles with many options for annotating, labeling, and animating the visualizations.
NG4.1 Home, Index, Examples, Glossary, Feedback, UG Contents, UG WhereAmI?