Chapter 15: Drawing axes, perimeters, and grids
Previous chapter LLUs Home Next chapter Index
The Gridall utility allows you to draw backgrounds for X/Y plots. It contains routines for drawing grids, perimeters, and pairs of axes. It also provides mechanisms for labeling your grids, perimeters, and axes, and for setting colors.
The following modules demonstrate how to use the GRIDAL routine to draw your choice of background, how to label your plot, and how to set color options.

This module organizes Gridall routines by their function. Please note that the GRIDAL entry point allows you to draw any of the options with a single routine call.
- GRID
- Draws an unlabeled grid.
- GRIDL
- Draws a labeled grid.
- HALFAX
- Draws a pair of intersecting axes.
- PERIM
- Draws an unlabeled perimeter.
- PERIML
- Draws a labeled perimeter.
- GRIDAL
- Draws any of the above.
- GACOLR
- Sets the color of grids, perimeters, axes, and labels.
- LABMOD
- Controls the format and direction of labels.
- TICK4
- Changes the length and direction of tick marks.
- GAGETI
- Retrieves the value of an integer parameter.
- GASETI
- Sets the value of an integer parameter
- GAGETR
- Retrieves the value of a real parameter.
- GASETR
- Sets the value of a real parameter.
- GAGETC
- Retrieves the value of a character parameter.
- GASETC
- Sets the value of a character parameter.
For a complete description of the Gridall parameters, see the gridall_params man page or the Gridall programmer document.
----------------------------------------------------
Parameter  Brief description            Fortran type
----------------------------------------------------
CAX        Color index for AXes         Integer
CLB        Color index for LaBels       Integer
CMJ        Color index for MaJor ticks  Integer
CMN        Color index for MiNor ticks  Integer
LTY        Labeling TYpe                Integer
WAX        Line Width of AXes           Real
WLB        Line Width of LaBels         Real
WMJ        Line Width of MaJor ticks    Real
WMN        Line Width of MiNor ticks    Real
XLF        X-axis Label Format          Character
XLL        X-axis Label Length          Integer
XLO        X-axis Label Offset          Real
XLS        X-axis Label Size            Real
XMJ        X-axis MaJor tick length     Real
XMN        X-axis MiNor tick length     Real
XOR        X-axis label ORientation     Integer
YLF        Y-axis Label Format          Character
YLL        Y-axis Label Length          Integer
YLO        Y-axis Label Offset          Real
YLS        Y-axis Label Size            Real
YMJ        Y-axis MaJor tick length     Real
YMN        Y-axis MiNor tick length     Real
----------------------------------------------------
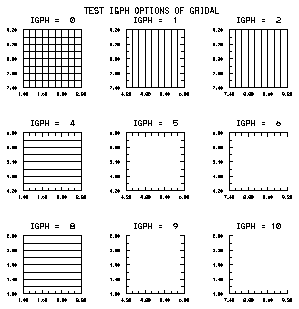
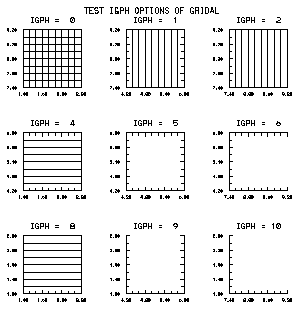
The GRIDAL routine is the Gridall utility's "do it all" routine. By changing a single value in the GRIDAL argument list, you can draw axes, perimeters, grid lines, or some combination of the three.

1       CALL PLCHLQ(.5,.9,'DEMONSTRATION PLOT FOR GRIDAL',16.,0.,0.)
2       CALL GRIDAL(5,2,6,3,1,1,IGPH,.3,.13)
3       CALL FRAME
CALL GRIDAL (MJRX, MNRX, MJRY, MNRY, IXLAB, IYLAB, IGPH, X, Y)
- MJRX, MJRY
- Integer, Input---The number of major divisions in the X and Y axes, respectively.
- MNRX, MNRY
- Integer, Input---The number of minor divisions in the X and Y axes, respectively.
The meanings of these arguments depend on the current setting of the linear/log flag in SPPS. This flag is set by the final argument in the SET call.
If the axis is linear, MJRX specifies the number of major divisions of the X/Y axis, and MNRX specifies the number of minor divisions within each major division. These values specify the number of spaces between GRIDAL lines or ticks, not the number of lines or ticks. Counting those at the ends, there is always one more major tick than the number of major divisions specified by MJRX. There is always one less minor tick than the number of minor divisions specified by MNRX.
If the axis is logarithmic, major division points occur at a value 10MJRX times the previous point. So if the minimum and maximum X-axis values are 3. and 3000., and MJRX is 1, then the major division points are 3., 30., 300., and 3000. If MNRX<=10, nine minor divisions between major divisions. For example, between 3. and 30., there would be minor division points at 6., 9., 12., 15., 18., 21., 24., and 27. If MNRX>10., minor divisions are omitted.
- IXLB, IYLB
- Integer, Input---IXLB and IYLB determine whether or not axes and axis labels are drawn. IXLB affects the X axis and labels, while IYLB affects the Y axis and labels.
- -1
- No axis or axis labels are drawn.
- 0
- Axis drawn without axis labels.
- 1
- Axis and axis labels are drawn.
- IGPH
- Integer, Input---Specifies the background type as indicated by one of the following integers:
--------------------------
IGPH  X axis     Y axis
--------------------------
0     grid       grid
1     grid       perimeter
2     grid       axis
4     perimeter  grid
5     perimeter  perimeter
6     perimeter  axis
8     axis       grid
9     axis       perimeter
10    axis       axis
--------------------------
- XINT, YINT
- Real, Input---The user "world" coordinates of the point of intersection of the two axes when IGPH=10. For other values of IGPH for which one of the axes is the axis type, XINT and/or YINT specifies the position of that axis.
Line 1 of the gridal.f code segment draws a title for the plot using Plotchar routine PLCHLQ. Line 2 uses a call to GRIDAL to draw the grid lines in the graphics and to draw the grid labels. Line 3 calls FRAME to end the picture. This is necessary since none of the Gridall routines automatically call FRAME.
Sometimes you may need to change the way that labels are formatted or change their orientation on the plot. In both cases, the Gridall routine LABMOD gives you the flexibility that you need.
LABMOD does not draw the labels; it must be called before the Gridall drawing and labeling routines, such as GRIDAL, GRIDL, PERIML, or HALFAX.

1       CALL LABMOD('(E7.2)','(E7.2)',0,0,10,10,0,0,1)
2       CALL GRIDAL(K-1,0,N-1,0,1,1,5,0.,0.)
3       CALL CPCLDR(Z,RWRK,IWRK)
4       CALL FRAME
CALL LABMOD (FMTX, FMTY, NUMX, NUMY, ISZX, ISZY, IXDC, IYDC, IXOR)
- FMTX, FMTY
- Character, Input---Contain format specifications for the X and Y axis numerical labels produced by GRIDAL, GRIDL, HALFAX, or PERIML. The specification must begin with a left parenthesis and end with a right parenthesis, and must not be more than ten characters long. Conversions of Fortran Format types E, F, G, and I are allowed. The default format is '(E10.3)'.
- NUMX, NUMY
- Integer, Input---If nonzero, NUMX is the number of characters in each X-axis numeric label. Labels with length less than NUMX will be padded at the end with blanks, allowing you to change the centering of labels. NUMY behaves in the same fashion.
- ISZX, ISZY
- Integer, Input---The character sizes for the labels. SIZE=ISZX/PAU, where SIZE is the size in NDCs, and PAU=1024 unless you've made a call to SETI.
- IXDC
- Integer, Input---The distance, in 1024ths of a screen width, from the left edge of the current viewport to the label specified by FMTY, NUMY, and ISZY. There are two special values of IXDC:
- 0
- The Y-axis labels end 20/1024ths of a screen width (0.02 NDCs) to the left of the viewport. This is equivalent to setting IXDC=20 and is the default.
- 1
- The Y-axis labels begin 20/1024ths of a screen width to the right of the viewport. This is equivalent to setting IXDC=20w, where w/1024 is the width of the viewport in NDCs.
- Negative values of IXDC specify the distance from the right edge of the viewport.
- When GRIDAL is called with IGPH=2, 6, or 10, IXDC is the distance from the Y axis, rather than from the minimum viewport coordinate, and special values 0 and 1 are equivalent to 20 and 20.
- IYDC
- Integer, Input---The distance, in 1024ths of a screen width, from the bottom edge of the current viewport to the label specified by FMTX, NUMX, and ISZX. There are two special values of IYDC:
- 0
- The X-axis labels end 20/1024ths of a screen width (0.02 NDCs) below the viewport. This is equivalent to setting IYDC=20.
- 1
- The X-axis labels begin 0.02 NDCs above the viewport. This is equivalent to setting IYDC=20h, where h/1024 is the height of the viewport in NDCs.
- The default value is 20.
- Negative values of IYDC specify the distance from the top edge of the viewport.
- When GRIDAL is called with IGPH=8, 9, or 10, IYDC is the distance from the X axis, rather than from the minimum viewport coordinate, and special values 0 and 1 are equivalent to 20 and 20.
- IXOR
- Integer, Input---Specifies the orientation of the X-axis labels.
- 0
- Horizontal.
- 1
- Vertical.
- The default orientation is horizontal.
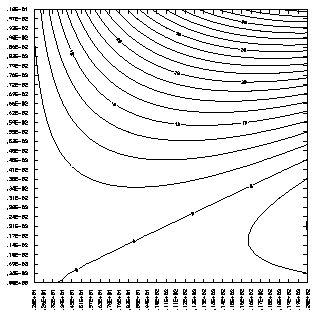
Line 1 of the ccpga.f code segment chooses our own label format and uses the default label size. Because the tick marks are so close together, it is necessary to draw the X axis labels vertically, which we do by setting IXOR to 1. Line 3 draws contour lines after the perimeter and labels are drawn.
GACOLR helps you set colors in your plot. GACOLR sets color indices for axes, labels, and major and minor grid lines or tick marks.

1       CALL COLOR
2       CALL GACOLR(1,2,3,4)
3       DO 100 IGPH=0,10
4          CALL SET(X1,X2,Y1,Y2,H1,H2,V1,V2,1)
5          CALL GRIDAL(3,3,4,2,1,1,IGPH,H1,V1)
6  100  CONTINUE
7       CALL FRAME
CALL GACOLR (KAXIS, LABEL, MJTICK, MNTICK)
- KAXIS
- Integer, Input---The color index of the desired color for the axes. KAXIS=0 by default.
- LABEL
- Integer, Input---The color index of the desired color for the axis labels. LABEL=0 by default.
- MJTICK
- Integer, Input---The color index of the desired color for the major tick marks or grid lines. MJTICK=0 by default.
- MNTICK
- Integer, Input---The color index of the desired color for the minor tick marks or grid lines. MNTICK=0 by default.
A value of less than 1 for any of the preceding arguments implies that no call is to be done to set the color before drawing the associated item.
GACOLR, like LABMOD, must be called before the plot is drawn by any of the Gridall drawing routines.
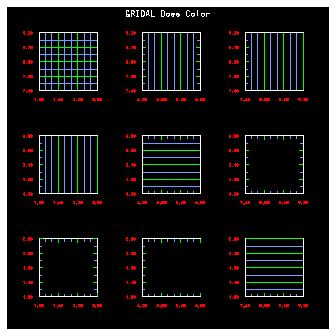
Line 1 of the gaclr.f code segment sets up a color table by calling a user-defined routine COLOR. Line 2 sets color choices for the grids, axes, and labels, using a call to GACOLR. Lines 3 and 6 set up a DO loop to draw each of the different kinds of plot that GRIDAL is capable of. Line 4 uses a SET call to determine where on the plot the grid, perimeter, or axes will be drawn. Line 5 calls GRIDAL to draw the grid, perimeter, or axes. Line 7 calls FRAME to close the picture.
Note: The gaclr example produces a color plot that does not reproduce well in black and white. Please view it on your screen.
Previous chapter LLUs Home Next chapter Index


