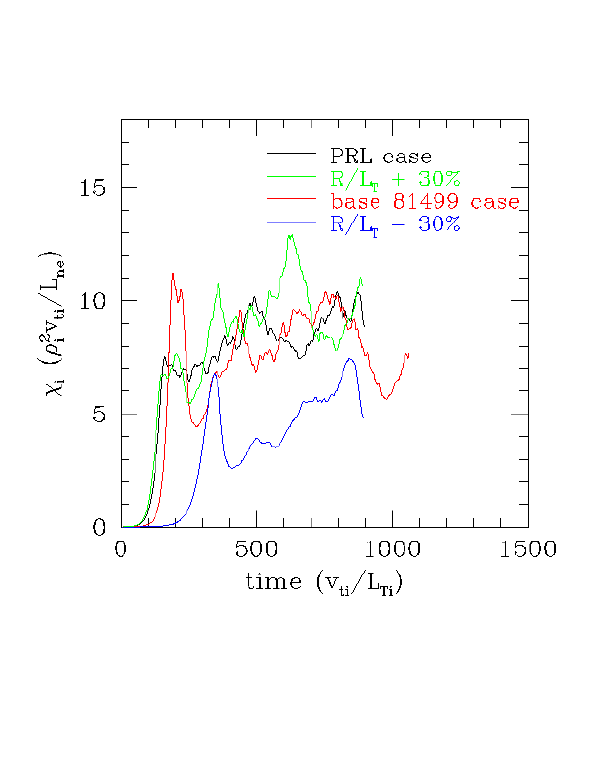
Below are several more GF data points for our test cases. These runs were all using a theta domain from (-pi,pi) to match Andris's results.
| GF Gryffin: | k_theta,max | gamma | omega_r | R/L_Tcrit | chi_i | phi^2 | |
|---|---|---|---|---|---|---|---|
| DIII-D base | 0.30 | 0.11 | -0.34 | 8 | |||
| DIII-D base + 30% | 0.35 | 0.19 | -0.47 | 10 | |||
| DIII-D base - 30% | 0.20 | 0.041 | -0.14 | 5 | |||
| NTP test | 0.35 | 0.14 | -0.46 | 7 | |||
| Dimits PRL | 0.35 | 0.19 | -0.42 | 9 | |||
| shat = 0 | |||||||
| zero out 0,0 | 0.30 | 0.11 | -0.34 | 30 |

The PRL case is indeed very similar to the DIII-D base case, as Bill suggested.
The DIII-D base -30% case is in marked contrast to Andris's result. I checked the growth rates for this case with a kinetic code. Our growth rates are only about 20% high at these parameters, indicating that this point is far enough from marginality that the GF inaccuracies in the threshold are not playing a big role here.
A few other observations which may already have been discussed:
Andris's values in Scott's table for "PRL" and "NTP" don't seem to match those in Andris's PRL Fig. 2a. Assuming that the x-scale is off by 10, I think that the "PRL" point is at qR/L_T=1.2 on this graph, and has chi_hat=0.6. The "NTP" point is at qR/L_T=2.4 and has chi_hat=1.0. So the ratio of NTP/PRL should be about 1.7 but in the table it's 2.6. Which one is missing the 1.5?
The Linear FULL value of R/L_T_crit in Scott's table looks way off to me.
--Mike
Back to index of cyclone pages
Back to Mike Beer's home page