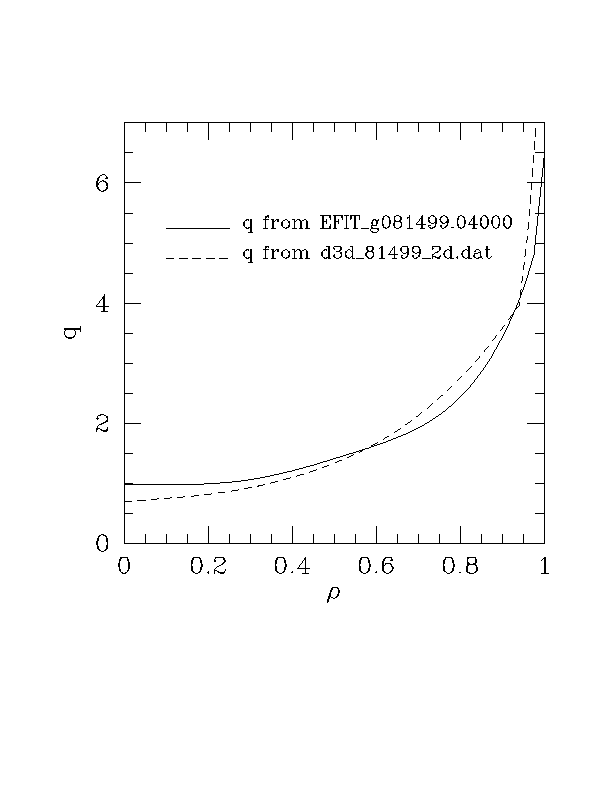
I've run into a potential problem with 81499. In the ITER fileserver directory /pub/gyro_code/d3d, there are two sources for the q profile for this shot: the EQDSK file EFIT_g081499.04000 and the profile data file d3d_81499_2d.dat. I get different q profiles from these two sources.
Since the EQDSK file gives q(Psi_p), you need to integrate Psi_T = \int q(Psi_p) dPsi_p to get q(rho) to compare to the 2d profile data file's q(rho). I did this with a simple numerical integration.
Here:
q = dPsi_T/dPsi_p
Psi_T = Toroidal flux
Psi_Ta = Toroidal flux at separatrix
Psi_p = Poloidal flux
rho = sqrt(Psi_T / Psi_Ta)
The following figure shows the two profiles.

If you want to check the numerical data, it's here: EFIT 2d database file
At rho=0.6, the q value is about the same, but the shear is different by about a factor of two. Which is correct? Why are they so different? It makes a big difference on my linear growth rates. Which q profile have people (Dimits, Staebler) been using? Is Gary's result general geometry or circular? --Mike
Back to index of cyclone pages
Back to Mike Beer's home page