Previous Chapter Tutorial Home Next Chapter
Because of the complexity of the Conpack labeling scheme, labeling has been divided into two sections, by function:
Note: Many contour line label options are covered in section "Cp 7. General labels" because they share common parameters or functions with general labels.
----------------------------------------------------------
    1.  Open GKS
    2.  Set window and viewport
 *  3.  Put in titles and other labels
 *  4.  Set up general parameters
    5.  Set up area maps
    6.  Initialize Conpack
    7.  Force Conpack to choose contour levels if necessary
    8.  Modify Conpack-chosen parameters
 *  9.  Draw labels
    10.  Draw background
    11.  Draw contour lines
    12.  Call FRAME
    13.  Close GKS

----------------------------------------------------------
* Steps discussed in this section.
There are many types of labels used in contour plots:
- Plot titles
- Constant field labels
- Information labels for the entire plot
- High/low labels
- Contour line labels
Each kind of label has specific options that are discussed in the appropriate module. Section "Cp 7. General labels" covers ways to produce titles, constant field labels, information labels, high/low labels, and how to control the numeric format of all other labels.
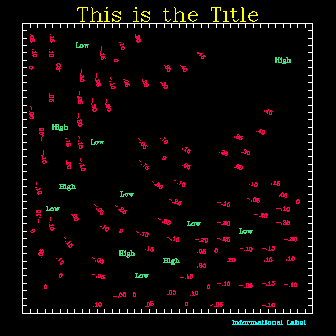
The plot titles and annotations shown in yellow in the example are technically not produced as Conpack functions. You must use the Plotchar utility to draw all user-defined titles and annotations after the contour plot. However, since most people want to title their plots, this procedure is covered in the following modules.
Controlling contour line labels (shown in red in the example) is a multifaceted operation that depends on which lines you want to be labeled, how much you care about where the labels go on any given contour line, and whether or not you want boxes around your labels (so that contour lines don't run through them or so that you can make them show up in color-filled or pattern-filled regions).
Controlling which contour lines you want to label and where the labels go on any given contour line, as well as other aspects like label size, text, and color are covered in section "Cp 6. Contour line labels." If you are interested in boxing your labels, please see modules "Cp 5.4 Adding label boxes to the area map," "Cp 5.5 Masking areas: Label boxes," and "Cp 5.6 Masking areas: Box masking routines."
High and low labels (shown in green in the example) have control mechanisms very similar to information labels, and so are discussed in the following modules.
The information label (shown in blue in the example) has control mechanisms very similar to the high and low labels and so is discussed in the following modules.
The constant field label is the least used of the Conpack labels. This label is only plotted when your data field is essentially constant. Constant field labels can be modified with options similar to the high, low, and information labels.
Titles are not produced with any Conpack subroutines. They are placed using the SPPS utilities GETSET and SET, and they are drawn with the Plotchar utility.
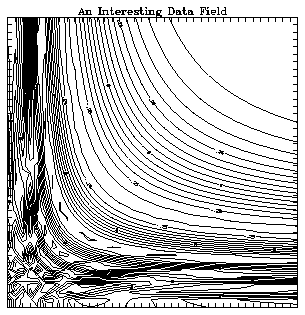
1       CALL GSCLIP (0)
2       CALL CPRECT (Z, M, M, N, RWRK, LRWK, IWRK, LIWK)
3       CALL CPBACK (Z, RWRK, IWRK)
4       CALL CPCLDR (Z, RWRK, IWRK)
5       CALL GETSET (VPL, VPR, VPB, VPT, WL, WR, WB, WT, LL)
6       SIZE = AMIN1 (.5 * (1.0 - VPT), .017)
7       Y = AMIN1 ((1.0 + VPT) / 2.0 + .017, .017 + VPT)
8       CALL SET (0.0, 1.0, 0.0, 1.0, 0.0, 1.0, 0.0, 1.0, 1)
9       CALL PLCHHQ (.5, Y, 'An Interesting Data Field', SIZE, 0., 0.)
CALL PLCHHQ (XPOS, YPOS, CHRS, SIZE, ANGD, CNTR)
- XPOS, YPOS
- Real, Input---The X and Y coordinate positions for the characters to be plotted. These are world coordinates. See the description of CNTR below.
- CHRS
- Character expression, Input---A string specifying the characters to be plotted.
- Caution: Do not use the characters ^ (caret), _ (underscore), or ` (single left quotation mark). Although these are ASCII characters, they do not exist in the PLCHHQ complex or duplex character sets. If you use one of these, the output character will be the five-pointed star that indicates an unrecognized character.
- SIZE
- Real, Input---Defines a multiplier for character size. Set the value of SIZE to a real number in one of the following ranges:
- <=0. The absolute value specifies the size as a multiple of the digitized size.
- 0.<SIZE<1.
Specifies the desired width of a character as a fraction of the distance across the plotter frame (in NDCs).
- ANGD
- Real, Input---The angle at which the character string is to be plotted, in degrees counterclockwise from the positive X axis.
- CNTR
- Real, Input---The centering option. Set the value of CNTR to a real number as follows:
- -1. The point (XPOS, YPOS) is the center of the top edge or the left edge of the first character (depending on whether that character is plotted "down" or "across").
- 1. The point (XPOS, YPOS) is the center of the bottom edge or the right edge of the last character (depending on whether that character is plotted "down" or "across").
- 0. The point (XPOS, YPOS) is the midpoint of the line joining the center of the top edge or the left edge of the first character (depending on whether that character is plotted "down" or "across") to the center of the bottom edge or the right edge of the last character (depending on whether that character is plotted "down" or "across").
- s Any real number can be used as s. The point (XPOS, YPOS) is a point obtained by linear interpolation along the line joining the point associated with the value -1. and the point associated with the value +1.
More detailed information is available in Chapter 11 "Drawing text and symbols" of NCAR Graphics Fundamentals.
Line 1 of the ccptitle.f code segment turns off clipping so that the information label appears. Lines 2, 3, and 4. initialize Conpack, draw a background, and draw contours as usual. Line 5 uses the SPPS routine GETSET to find out where the contour rectangle has been placed. The first four arguments to GETSET return the left, right, bottom, and top sides of the contour rectangle respectively. Since we want to place the title a little above the plot in this case, we find out the distance between the top of the plot and the top of the viewport, then make our characters roughly half that distance tall (a good size).
Line 7 computes the Y coordinate for the center of the text so that line 9 can call PLCHHQ to draw the title. Notice that line 8 calls SET. This resets the viewport to the entire plotter frame. The SET call also resets user coordinates to Normalized Device Coordinates so that the characters are drawn in NDC units rather than in Conpack's user coordinates.
- Move the title of the ccptitle example so it appears below the plot, and change it to say "This is a title."
- Draw the title of the ccptitle example sideways on the left edge of the plot.
Two parameters control the number of significant digits in numeric labels: NSD and NLS. These parameters control high, low, information, and constant field label output simultaneously.
NSD, Number of Significant Digits
- Assume that the contour field varies between 1123.6 and 1125.9
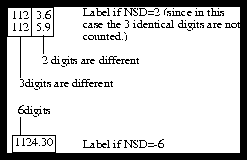
NLS, Numeric Leftmost Significant digit
- Assume the use of three significant digits
- If NLS=0: .500 1.00 1.50 . . . 9.50 10.5
- If NLS<>0: .5 1.0 1.5 . . . 9.5 10.5
      CALL CPSETI ('NSD', nsd)
      CALL CPSETI ('NLS', nls)
- NSD
- Integer---The Number of Significant Digits parameter specifies the maximum number of significant digits used in numeric labels. By default, NSD=4.
- n<0
Specifies that ABS(n) significant digits should be used.
- n>=0
Specifies that m+n digits should be used, where m is the number of digits that are the same for all values in the contour field. For example, if the minimum value is 1123.6 and the maximum value is 1125.9, then the value of m is 3.
- NLS
- Integer---The Numeric Leftmost Significant digit flag controls what is considered to be the the first significant digit.
- 0 The leftmost nonzero digit of a number is considered its first significant digit.
- <>0 The digit in the same digit position as the leftmost nonzero digit of the largest number (in absolute value) in the data field being contoured is considered to be the leftmost significant digit. This option tends to make labels more consistent. In a Fortran FORMAT statement, the form would be Fn.m, where n is the number of digits in either the largest or smallest contour field value. This is the default.
As shown in the "NSD, Number of Significant Digits" example in the illustration, the parameter NSD can mean different things depending on how it is set. If you set it to a negative number, it sets the exact number of significant digits. However, if you set it to a positive number, Conpack finds the range of the contoured field, then finds the number of digits that are the same in the minimum and maximum values, and does not count those digits as part of the number of significant digits. Where we have three similar digits and two dissimilar digits in the illustration, we set NSD=2 to get five digits in our label. The number of significant digits in each type of label varies, and this affects exactly how the label is written.
The "NLS, Numeric Leftmost Significant digit" example in the illustration shows how the NLS flag works. By default, Conpack takes the absolute value of the largest and smallest values in the data field. Using the largest value, Conpack determines the number of significant digits for that value from NLS. Then Conpack makes all labels have the same number of digits following the decimal point as that value. The illustration shows that when NLS<>0, each label has one digit following the decimal point. However, when NLS=0, the leftmost nonzero digit of each label is the first significant digit. Therefore, each label has a different number of digits after the decimal point.
- Using the cidsfft example, add a call to CPLBDR to draw information and high/low labels. Use both positive and negative values of NSD to get five significant digits.
- Using your solution to exercise 1, turn off NLS and see if there is any difference. Which option overrides the other?
Hint: if you would like to see an example using these two parameters, run the ccpnsd example.
Two parameters control leading and trailing zeros, trailing decimals, and so forth in numeric labels: NLZ and NOF. These parameters control high, low, information, constant field, and contour line label output simultaneously.
Table 1: NLZ, Numeric Leading Zero flag
-----------------------
.395   Label with NLZ=0
0.395  Label with NLZ<>0

-----------------------
Table 2: NOF, Numeric Omission Flag
-------------------------------------------------------------
This     Not this
-------------------------------------------------------------
46.2000            NOF=0 (nothing omitted)
46.2     46.2000   NOF=1 (trailing zeros omitted)
13       13.       NOF=2 (trailing decimal omitted)
13       13.00     NOF=3 (trailing zeros and decimal omitted)
1013     1 x 10¹³  NOF=4 ("1 x" omitted)
-------------------------------------------------------------
      CALL CPSETI ('NLZ', nlz)
      CALL CPSETI ('NOF', nof)
- NLZ
- Integer---The Numeric Leading Zero flag controls whether or not a leading zero is placed before a decimal point.
- 0 No zero is added to numeric labels. This is the default.
- <>0 A zero is placed before decimal points.
- NOF
- Integer---The Numeric Omission Flag specifies which parts of a numeric label may be omitted.
- 0 No part may be omitted.
- 1 Trailing zeros (as in .2500) may be omitted.
- 2 Trailing decimals (as in 1.) may be omitted.
- 4 Leading "1 x" notation may be omitted (as in 1 x 10¹³)
- To get combined effects, add two or more of the above values together, and set NOF equal to the sum. By default, NOF=6.
In the "NLZ, Numeric Leading Zero flag" example of the illustration, note that setting NLZ<>0 puts a zero before a decimal number. The Numeric Omission Flag NOF controls three other numerical aspects: trailing zeros, trailing decimals, and whether or not you get a leading "1 x" in exponential notation.
You can turn NOF off by setting NOF=0. If you want trailing zeros omitted, set NOF=1. If you want trailing decimals omitted, set NOF=2. Or, if you have exponential numbers, you can change 1 x 10¹³ to just 1013 by setting NOF=4.
Notice that in the "NOF, Numeric Omission Flag" example, NOF=3 is a combination of NOF=1 and NOF=2. Similarly, NOF=5 is a combination of NOF=1 and NOF=4. NOF=6 is the default value, and indicates that exponentials are written without a leading "1 x", and trailing decimals are omitted. To get all the options, set NOF=7. The number of significant digits in each type of label varies, and this affects exactly how the label is written.
Note: Contour line labels and values in the information label that are known to have been rounded to "nice" values have trailing zeros trimmed, no matter what value is assigned to NOF.
- Using the ccpnsd example, comment out all statements referring to LIT and CIT, then remove trailing zeros and decimals.
- Using the above exercise, put a zero before any decimal numbers.
Hint: Run the ccpnof example if you would like to see the NOF and NLZ parameters demonstrated.
Three parameters control exponents in numeric labels: NEL, NET, and NEU. These parameters control high, low, information, constant field, and contour line label output simultaneously.
Table 3: NEL, Numeric Exponent Length
-------------------------------
3.5 x 10¹³     Label with NEL<=0
3.5 x 10+0013  Label with NEL=4

-------------------------------
Table 4: NET, Numeric Exponent Type
------------------------------
3.5 E+13      Label with NET=0
3.5 x 10¹³    Label with NET=1
3.5 x 10**13  Label with NET=2

------------------------------
Table 5: NEU, Numeric Exponent Use flag
---------------------------
6.9 x 10⁴  Label with NEU<=0
69000      Label with NEU=3
---------------------------
      CALL CPSETI ('NEL', nel)
      CALL CPSETI ('NET', net)
      CALL CPSETI ('NEU', neu)
- NEL
- Integer---The Numeric Exponent Length parameter controls whether or not leading zeros are used in an exponent. NEL=0 by default.
- <=0 Exponents are written in the shortest possible form. Plus signs are omitted.
- n>0
Exponents are written with a sign, and the exponent is padded to a length of n with leading zeros.
- NET
- Integer---The Numeric Exponent Type parameter determines what characters are used between the mantissa of a numeric label and the exponent. By default, NET=1.
- 0 Specifies the use of an E, just as you would get if you used a Fortran FORMAT(En.m)
- 1 Specifies that the exponent is superscripted.
- 2 Specifies a format like "1.11 x 10**12"
- NEU
- Integer---The Numeric Exponent Use flag decides when to force the use of exponential notation. By default, NEU=5.
- <=0 Forces exponential notation in all labels.
- n>0
Specifies exponential notation when it uses no more than n characters. Otherwise, the form requiring the fewest characters is used.
The "NEL, Numeric Exponent Length" illustration shows that NEL controls how many zeros are used to pad an exponent. By setting NEL>0, you can make your labels more consistent. NEL is normally used when NET=0 or NET=1.
NET is used to determine exactly how exponents are displayed: either in a Fortran format or in mathematical notation format. By default, exponents are displayed in a mathematical format.
The "NEU, Numeric Exponent Use flag" illustration shows that you can either force exponential form on every label, or you can use it only for labels that would be excessively long without exponents. The number of significant digits in each type of label varies, and this affects exactly how the label is written.
- Using the ccpnet example, change the exponents to use the Fortran E format.
- Using the ccpnet example, pad the exponents so that they are a minimum of two digits.
- Using the ccpnet example, remove leading zeros from labels.
Three parameters control label angles or label orientations for high, low, information, and constant field labels: HLA, ILA, and CFA. These parameters allow you to control each kind of label individually.
1       CALL GSCLIP (0)
2       CALL CPSETR ('HLA - HIGH/LOW LABEL ANGLE', 30.)
3       CALL CPSETR ('ILA - INFORMATION LABEL ANGLE', -100.)
4       CALL CPSETR ('ILX - INFORMATION LABEL X COORDINATE', -0.02)
5       CALL CPSETR ('ILY - INFORMATION LABEL Y COORDINATE', 0.25)
6       CALL CPSETI ('ILP - INFORMATION LABEL POSITION', 0)
7       CALL CPRECT (Z, M, M, N, RWRK, LRWK, IWRK, LIWK)
8       CALL CPBACK (Z, RWRK, IWRK)
9       CALL CPLBDR (Z, RWRK, IWRK)
10      CALL CPCLDR (Z, RWRK, IWRK)
      CALL CPSETR ('CFA', cfa)
      CALL CPSETR ('HLA', hla)
      CALL CPSETR ('ILA', cila)
- CFA
- Real---The Constant Field label Angle parameter specifies the angle in degrees at which a constant field label is to be drawn. By default, CFA=0.
- HLA
- Real---The High/Low label Angle parameter specifies the angle at which high and low labels are to be drawn. By default, HLA=0. All high and low labels must be drawn at the same angle.
- ILA
- Real---The Information Label Angle parameter specifies the angle in degrees at which the information label is written. By default, ILA=0.
Line 1 of the ccpila.f code segment turns off clipping so that the information label shows up. Lines 2 and 3 set up the angles for the high, low, and information labels. Because there is no option to control label angle separately for the high and low labels, both high and low labels must be drawn at the same angle.
Lines 4 through 6 move the information label to the lower left edge of the plot. These parameters are described in detail in module "Cp 7.14 Label placement: Constant field and information labels."
In this example, we know that the data are nonconstant. There is therefore no reason to set up a constant field label angle. However, if you are plotting many data fields with the same subroutine, you may want to set CFA here as well. Lines 7 through 10 call Conpack normally.
- Modify the ccpila example so that it prints out a constant field message, and turn the constant field message upside down.
There are three options controlling contour label size, one for each type of label: CFS controls the constant field label, HLS controls the high and low labels, and ILS controls the information label.
1       CALL CPSETR ('HLS - HIGH/LOW LABEL SIZE', .030)
2       CALL CPSETR ('ILS - INFORMATION LABEL SIZE', .005)
3       CALL CPRECT (Z, M, M, N, RWRK, LRWK, IWRK, LIWK)
4       CALL CPBACK (Z, RWRK, IWRK)
5       CALL CPLBDR (Z, RWRK, IWRK)
      CALL CPSETR ('CFS', cfs)
      CALL CPSETR ('HLS', hls)
      CALL CPSETR ('ILS', rils)
      CALL CPSETR ('CWM', cwm)
- CFS
- Real---The Constant Field label Size parameter controls the character size for constant field labels. 0.0<=CFS<=1.0. By default, CFS=.012.
- HLS
- Real---The High/Low label Size parameter controls the character size for high and low labels. 0.0<=HLS<=1.0. By default, HLS=.012.
- ILS
- Real---The Information Label Size parameter controls the character size for information labels. 0.0<=ILS<=1.0. By default, ILS=.012.
- CWM
- Real---The Character Width Multiplier parameter allows you to scale all label sizes up or down simultaneously (all character size multipliers are multiplied by CWM). CWM affects the parameters CFS, DPS, HLS, ILS, LLS, CFW, DPV, HLW, ILW, and LLW. By default, CWM=1.0.
All labels are sized in fractions of the width of the viewport. Rarely will you want labels larger than .02, and as shown in the ccpils example, it takes a printer of extremely high resolution to do justice to text at .005.
If you like the proportions of the labels, but you want to make them all smaller or larger at the same time, use the CWM parameter. For example, if you need the high/low labels and the information label to be 50% larger for better readability in publication, you would set CWM to 1.5.
Lines 1 and 2 of the ccpils.f code segment set high and low labels to be large, and set the information label to be very small. As shown in the graphic, the information label is small enough to be unreadable on many devices. Conpack is then called normally; however in this case, we eliminate the call to draw the contours since contours would obscure the high and low labels that we want to show.
- Can you set high labels to be a different size than low labels? Why or why not?
- Change the ccpils example so that all labels are drawn 25% larger than the default size.
The CFT parameter controls the constant field text, and the ILT parameter controls the information label text. Both labels can use special variables that retrieve and insert numerical information about your contour field.
1       CALL CPSETC ('ILT - INFORMATION LABEL TEXT STRING', 'Modified Sine
       + Function Contoured from $CMN$ to $CMX$ by $CIU$')
2       CALL CPRECT (Z, M, M, N, RWRK, LRWK, IWRK, LIWK)
3       CALL CPBACK (Z, RWRK, IWRK)
4       CALL CPLBDR (Z, RWRK, IWRK)
5       CALL CPCLDR (Z, RWRK, IWRK)
      CALL CPSETC ('CFT', cft)
      CALL CPSETC ('ILT', cilt)
- CFT (CHARACTER*40)
- Character expression---The Constant Field label Text string parameter specifies the text of the constant field label. It can be up to 40 characters long and can display the numeric value of the field if the string $ZDV$ is embedded in it. By default, CFT='CONSTANT FIELD VALUE IS $ZDV$'. If CFT=' ' (a single blank), the constant field label is not drawn.
- ILT (CHARACTER*100)
- Character expression---The Information Label Text string parameter specifies the text of the information label. The following strings are replaced with numeric values in the label:
--------------------------------------
$CIU$  Contour interval used
$CMN$  Minimum contour level
$CMX$  Maximum contour level
$SFU$  Current scale factor
$ZMN$  Minimum value in the data array
$ZMX$  Maximum value in the data array
--------------------------------------
- In each case except $SFU$, the given value is first divided by the current scale factor. You can insert U just before the final $ (for example $CIUU$ or $CMXU$) to request the unscaled value.
- $CIU$ is only correct if Conpack chooses contour levels; otherwise, to get a correct value, you may need to set the parameter CIU before the label is drawn.
- By default, ILT='CONTOUR FROM $CMN$ TO $CMX BY $CIU$'. If ILT=' ' (a single blank), then the information label is not drawn.
Lines 1 and 2 of the ccpilt.f code segment set up the information label text string to give us "Modified Sine Function Contoured from -.3 to .45 by .05." Notice that we have used the variables $CMN, $CMX, and $CIU to get the minimum and maximum contour levels, and the contour level interval. The rest of the code draws contours and labels in the familiar way.
- Change the ccpilt example to use the default information label, but make it print out the scale factor. In addition, move the information label to the left side of the plot and make the text run vertically.
The HLT parameter controls high and low label text strings. It allows you to specify the character strings for labeling highs and lows either individually or together.
1       CALL CPSETC ('HLT - HIGH/LOW LABEL TEXT STRINGS',
       + 'Local High ($ZDV$)''Local Low ($ZDV$)')
2       CALL CPRECT (Z, M, M, N, RWRK, LRWK, IWRK, LIWK)
3       CALL CPBACK (Z, RWRK, IWRK)
4       CALL CPCLDR (Z, RWRK, IWRK)
5       CALL CPLBDR (Z, RWRK, IWRK)
CALL CPSETC ('HLT', hlt)
- HLT(CHARACTER*40)
- Character expression---The High/Low label Text strings parameter allows you to specify the text strings you want to print for high and low labels. By setting HLT to a single text string (one with no embedded single quotation marks), highs and lows are both labeled the same way.
- By setting HLT to a text string that has two single quotation marks together inside the string, the text before the single quotation marks will be used to label highs, and the text after the single quotation marks will be used to label lows. Neither the high nor the low text string may exceed 20 characters.
- The substring $ZDV$, when included in a label, is to be replaced by the value of the high or low divided by the scale factor. $ZDVU$ is to be replaced by the unscaled value of the high or low.
To give you a feel for how HLT works, here is a table showing the Fortran string and the corresponding result:
-------------------------------------------------------
Fortran string                   High label  Low label
-------------------------------------------------------
1. '$ZDV$'                       1.363       -5.6
2. 'Inflection Point'            Inflection  Inflection
                                 Point       Point
3. 'High''Low'                   High        Low
4. 'H ($ZDV$)''L ($ZDV$)'        H (1.363)   L (-5.6)
5. 'H:B:$ZDV$:E:''L:B:$ZDV$:E:'
                                 H1.363      L-5.6
-------------------------------------------------------
In string 1, high and low labels are set to the numerical value of the point by using $ZDV$. Since there is only a single quoted string in string 2, all highs and lows are labeled with the words "Inflection Point". String 3 labels highs with the word "High", and lows with the word "Low". String 4 uses $ZDV$ to print an "H" for highs, and "L" for lows, and the value of the high or the low in parentheses.
String 5 gives the default labels for highs and lows. In the first part, "H" is the text, ":B:" is a Plotchar function code to induce subscripting, "$ZDV$" prints the numerical value of the high as a subscript, and ":E:" centers the "H" on the high. The low label is nearly identical, using "L" to specify lows, rather than "H". For more information on the Plotchar function codes, please see Chapter 11 "Drawing text and symbols" in the NCAR Graphics Fundamentals guide.
Line 1 of the ccphlt.f code segment sets the high and low labels to be rather long strings of "Local High (val)" and "Local Low (val)" where val is the value of the high or low. The clipping of the labels is caused by the length of the label. Generally, it is best to make high and low labels as short as possible. Lines 2 through 5 initialize and draw contours with the usual calls.
- Using the ccphlt example, set high labels to the default, and set low labels so that they just print out the value of the low.
- Change the ccphlt example to make the words "High" and "Low" come out as superscripts to the values of the highs and lows.
Five parameters control the color of high, low, information, and constant field labels: HIC, LOC, HLC, ILC, and CFC. You can control each kind of label individually, or the high and low labels as an entity.

1       CALL GSCLIP (0)
2       CALL COLOR
3       CALL CPSETI ('HLC - HIGH/LOW LABEL COLOR INDEX', 9)
4       CALL CPSETC ('HLT - HIGH/LOW LABEL TEXT STRINGS', 'High' 'Low')
5       CALL CPSETI ('ILC - INFORMATION LABEL COLOR INDEX', 2)
6       CALL CPSETC ('ILT - INFORMATION LABEL TEXT', 'Informational Label')
7       CALL CPRECT (Z, M, M, N, RWRK, LRWK, IWRK, LIWK)
8       CALL CPPKCL (Z, RWRK, IWRK)
9       CALL CPBACK (Z, RWRK, IWRK)
10      CALL CPLBDR (Z, RWRK, IWRK)
11      CALL CPCLDR (Z, RWRK, IWRK)
      CALL CPSETI ('CFC', icfc)
      CALL CPSETI ('HLC', ihlc)
      CALL CPSETI ('ILC', icilc)
- CFC
- Integer---The Constant Field label Color index specifies which color is used to draw the constant field label.
- <0 The label (and the box around it, if any) are drawn in the color specified by the current text color index. This is the default.
- >=0 The label (and the box around it, if any) is drawn in the color specified by the color table.
- HIC
- Integer---The HIgh label Color index is used to determine the color index for high labels. HIC is partially dependent on HLC, described below. HIC=-1 by default.
- LOC
- Integer---The LOw label Color index is used to determine the color index for low labels. LOC is partially dependent on HLC, described below. LOC=-1 by default.
- HLC
- Integer---The High/Low label Color index is used to determine the color index for high and low labels. HLC=-1 by default.
- The color index for high labels is determined in this manner:
- If HIC>=0, HIC is used as the color index.
- If HIC<0, but HLC>=0, HLC is used as the color index.
- If both HIC and HLC are less than zero, the current text color index is used.
- The color index for low labels is determined similarly:
- If LOC>=0, LOC is used as the color index.
- If LOC<0, but HLC>=0, HLC is used as the color index.
- If both LOC and HLC are less than zero, the current text color index is used.
- ILC
- Integer---The Information Label Color index specifies the color of the information label.
The HIC, LOC, and HLC parameters show that there are several ways to set high and low label color. If you want the label color to match the text color, do nothing (use the default setting). If you want to set high and low labels together, you can do this with a single parameter: set HLC>0. If you want to set high labels to one color, and low labels to another color, you can do this by setting HIC and LOC.
If you have defined a color table, and you set any of the preceding parameters equal to zero, then the label(s) come out in the background color---the one color that does not show up on your plot! In other words, if you set ILC=0 and your background color is black, then both your background and your information label are black, making the information label invisible.
Line 1 of the ccplbdr.f code segment turns off clipping so that the information label shows up. Line 2 sets up the color table via a subroutine call. Lines 3 and 5 specify the color indices for the high, low, and information labels. Lines 4 and 6 specify the text for these labels.
In this example, we know that the data are nonconstant. There is therefore no reason to set up a constant field label color index. However, if you are plotting many data fields with the same subroutine, you may want to set CFC here as well.
Lines 7 through 11 call Conpack normally. Notice that the text of the high, low, and information labels is not the default. Changing label text is discussed in the label text modules Cp 7.8 and Cp 7.9.
- Modify the ccplbdr example so the title is white, highs are green, lows are red, contour line labels are blue, and the information label is magenta.
There are a few label attributes that have not been previously discussed because you may need to put your contours and labels into an area map to use them. Information, constant field, contour line, and high/low labels can all be boxed to protect them from contour lines or various fill options. The label box flags, CFB, HLB, ILB, and LLB control whether or not a label box is outlined or filled.
1       CALL CPSETI ('LLP - LINE LABEL POSITIONING', 2)
2       CALL CPSETI ('LLB - LINE LABEL BOX FLAG', 2)
3       CALL CPSETI ('HLB - HIGH/LOW LABEL BOX FLAG', 3)
4       CALL CPSETI ('ILB - INFORMATION LABEL BOX FLAG', 1)
5       CALL CPSETI ('LBC - LABEL BOX COLOR INDEX', 18)
6       CALL CPRECT (ZREG, MREG, MREG, NREG, RWRK, LRWK, IWRK, LIWK)
7       CALL CPLBDR (ZREG, RWRK, IWRK)
      CALL CPSETI ('CFB', icfb)
      CALL CPSETI ('HLB', ihlb)
      CALL CPSETI ('ILB', ilb)
      CALL CPSETI ('LLB', llb)
      CALL CPSETI ('LBC', lbc)
- CFB
- Integer---The Constant Field label Box flag controls how the constant field label is boxed.
- 0 Labels drawn by CPLBDR are not boxed. CFB=0 by default.
- 1 The perimeter of the box is drawn in the same color as the label, after the label is drawn.
- 2 The box is filled in the color specified by LBC before the label is drawn.
- 3 Both 1 and 2 above.
- HLB
- Integer---The High/Low label Box flag controls how high and low labels are boxed.
- 0 Labels drawn by CPLBDR are not boxed. HLB=0 by default.
- 1 The perimeter of the box is drawn in the same color as the label, after the label is drawn.
- 2 The box is filled in the color specified by LBC before the label is drawn.
- 3 Both 1 and 2 above.
- ILB
- Integer---The Information Label Box flag controls how information labels are boxed.
- 0 Labels drawn by CPLBDR are not boxed. ILB=0 by default.
- 1 The perimeter of the box is drawn in the same color as the label after the label is drawn.
- 2 The box is filled in the color specified by LBC before the label is drawn.
- 3 Both 1 and 2 above.
- LLB
- Integer---The Line Label Box flag controls how contour line labels are boxed:
- 0 Labels drawn by CPLBDR are not boxed. LLB=0 by default.
- 1 The perimeter of the box is drawn in the same color as the label after the label is drawn.
- 2 The box is filled in the color specified by LBC before the label is drawn.
- 3 Both 1 and 2 above.
- LBC
- Integer---The Label Box Color index parameter sets the color for the interiors of label boxes. By default, LBC=0.
- <0 Current fill color index is used.
- >=0 Specifies color index to be used.
If you are using a device that can overlay images, such as an X-window display or a Video Display Terminal (VDT), you don't need to use the label box options in conjunction with Areas. Simply draw your labels (by calling CPLBDR) after drawing your contours (by calling (CPCLDR).
Line 1 of the ccpllb.f code segment chooses the regular scheme for line labeling. Line 2 sets the line label box to be filled. Line 3 sets the high and low label boxes to be filled and outlined. Line 4 sets the information label to be outlined but not filled. Line 5 sets the internal box color to gray. Line 6 initializes Conpack, and line 7 draws the labels.
- Change the box color to aqua in the ccpllb example.
- Modify the ccpllb example so that all the boxes are black with white outlines.
Label boxes for constant field, high/low, information, and contour line labels have line width (thickness) control parameters: CFL, HLL, ILL, and LLL respectively.
1       CALL CPSETI ('LLP - LINE LABEL POSITIONING', 2)
2       CALL CPSETI ('LLB - LINE LABEL BOX FLAG', 1)
3       CALL CPSETI ('HLB - HIGH/LOW LABEL BOX FLAG', 1)
4       CALL CPSETI ('ILB - INFORMATION LABEL BOX FLAG', 1)
5       CALL CPSETR ('LLL - LINE LABEL LINE WIDTH', 1.)
6       CALL CPSETR ('HLL - HIGH/LOW LABEL LINE WIDTH', 3.)
7       CALL CPSETR ('ILL - INFORMATION LABEL LINE WIDTH', 5.)
8       CALL CPRECT (ZREG, MREG, MREG, NREG, RWRK, LRWK, IWRK, LIWK)
9       CALL CPPKCL (ZREG, RWRK, IWRK)
10      CALL CPBACK (ZREG, RWRK, IWRK)
11      CALL ARINAM (MAP, LMAP)
12      CALL CPLBAM (ZREG, RWRK, IWRK, MAP)
13      CALL CPLBDR (ZREG, RWRK, IWRK)
14      CALL CPCLAM (ZREG, RWRK, IWRK, MAP)
15      CALL ARSCAM (MAP, XWRK, YWRK, NWRK, IAREA, IGRP, NOGRPS, FILL)
      CALL CPSETR ('CFL', cfl)
      CALL CPSETR ('HLL', hll)
      CALL CPSETR ('ILL', rill)
      CALL CPSETR ('LLL', rlll)
- CFL
- Real---The Constant Field label box Line width parameter determines the line width of boxes drawn around labels. CFL=0.0 by default.
- <=0. Line width is not set before drawing boxes around constant field labels.
- >0. The value indicates the desired width as a multiple of the normal line width.
- HLL
- Real---The High/Low label box Line width parameter determines the line width of boxes drawn around labels. HLL=0.0 by default.
- <=0. Line width is not set before drawing boxes around high/low labels.
- >0. The value indicates the desired width as a multiple of the normal line width.
- ILL
- Real---The Information Label box Line width parameter determines the line width of boxes drawn around labels. ILL=0.0 by default.
- <=0. Line width is not set before drawing boxes around information labels.
- >0. The value indicates the desired width as a multiple of the normal line width.
- LLL
- Real---The Line Label Line width parameter determines the line width of boxes drawn around labels. LLL=0.0 by default.
- <=0. Line width is not set before drawing boxes around contour line labels.
- >0. The value indicates the desired width as a multiple of the normal line width.
Lines 5 through 7 set the width of box lines in the ccplll.f code segment. Line 5 sets the contour label box line thickness to 1.0, giving us the default line thickness. Line 6 sets the high/low box line thickness to 3.0, drawing a reasonably thick line, and line 7 sets the information box line thickness to 5.0, drawing a very heavy line. Not all output devices are created equal, and on many printers you may have to use a much broader spectrum of widths to get the kind of differentiation shown here.
- Using the ccplll example, change the high/low label box line thicknesses to .1, and the information label box line thickness to 10.
Conpack also provides parameters that control the amount of white space in each label box. These parameters therefore control the size of the label box.
1       CALL CPSETI ('LLP - LINE LABEL POSITIONING', 2)
2       CALL CPSETI ('LLB - LINE LABEL BOX FLAG', 1)
3       CALL CPSETI ('HLB - HIGH/LOW LABEL BOX FLAG', 1)
4       CALL CPSETI ('ILB - INFORMATION LABEL BOX FLAG', 1)
5       CALL CPSETR ('LLW - LINE LABEL WHITE SPACE', .02)
6       CALL CPSETR ('HLW - HIGH/LOW LABEL WHITE SPACE WIDTH', 0.)
7       CALL CPSETR ('ILW - INFORMATION LABEL WHITE SPACE WIDTH', .03)
8       CALL CPRECT (ZREG, MREG, MREG, NREG, RWRK, LRWK, IWRK, LIWK)
9       CALL CPBACK (ZREG, RWRK, IWRK)
10      CALL ARINAM (MAP, LMAP)
11      CALL CPLBAM (ZREG, RWRK, IWRK, MAP)
12      CALL CPCLAM (ZREG, RWRK, IWRK, MAP)
13      CALL ARSCAM (MAP, XWRK, YWRK, NWRK, IAREA, IGRP, NOGRPS, FILL)
14      CALL CPLBDR (ZREG, RWRK, IWRK)
CALL CPSETR ('LLW', rllw)
- CFW
- Real---The Constant Field label White space parameter controls the width of the white space around a constant field label. W=LLW*CWM, where W is white space width in fractions of the viewport width; CWM is described below. CFW=0.005 by default.
- HLW
- Real---The High/Low label White space parameter controls the width of the white space around a high/low label. W=LLW*CWM, where W is white space width in fractions of the viewport width; CWM is described below. HLW=0.005 by default.
- ILW
- Real---The Information Label White space parameter controls the width of the white space around an information label. W=LLW*CWM, where W is white space width in fractions of the viewport width; CWM is described below. ILW=0.005 by default.
- LLW
- Real---The contour Line Label White space parameter controls the width of the white space around a contour line label. W=LLW*CWM where W is white space width in fractions of the viewport width; CWM is described below. LLW=0.005 by default.
- CWM
- Real---The Character Width Multiplier parameter affects all label sizes. This makes it easy to scale the sizes of all labels up or down simultaneously. CWM affects CFS, DPS, HLS, ILS, LLS, CFW, DPV, HLW, ILW, and LLW. By default, CWM=1.0.
Lines 5 through 7 of the ccpllw.f code segment control the sizes of label boxes. Line 5 tells Conpack that we don't want any white space around the contour label; this produces small contour line labels. Line 6 asks for a large amount of white space around the high and low labels; this produces very large boxes. Line 7 asks for a moderate amount of white space around the information label and produces a nice margin.
- Using the ccpllw example, make the label boxes for the contour lines reasonably large.
Six parameters allow you to control the position of the constant field label or the information label in your plot. CFX and CFY specify the X and Y coordinates of the base point of the constant field label. ILX and ILY specify the X and Y coordinates of the base point of the information labels. CFP and ILP allow you to control the labels' positions relative to the base point.
1       CALL CPSETR ('CFX - CONSTANT FIELD LABEL X COORDINATE', 0.)
2       CALL CPSETR ('CFY - CONSTANT FIELD LABEL Y COORDINATE', 1.)
3       CALL CPSETI ('CFP - CONSTANT FIELD POSITION FLAG', 2)
4       CALL CPRECT (Z, M, M, N, RWRK, LRWK, IWRK, LIWK)
5       CALL CPBACK (Z, RWRK, IWRK)
6       CALL CPLBDR (Z, RWRK, IWRK)
7       CALL CPCLDR (Z, RWRK, IWRK)
      CALL CPSETR ('CFX', cfx)
      CALL CPSETR ('CFY', cfy)
      CALL CPSETI ('CFP', icfp)
      CALL CPSETR ('ILX', rilx)
      CALL CPSETR ('ILY', rily)
      CALL CPSETI ('ILP', ilp)
- CFX and CFY
- Real---The Constant Field label X coordinate and Constant Field label Y coordinate parameters specify the X and Y viewport coordinates, in NDCs, of a point relative to which the constant field label is to be positioned as specified by the value of CFP. By default, CFX=CFY=0.5.
- ILX and ILY
- Real---The Information Label X coordinate and Information Label Y coordinate parameters specify the X and Y viewport coordinates, in NDCs, of a point relative to which the information label is to be positioned as specified by the value of ILP. By default, ILX=0.98, and ILY=-.02.
- CFP and ILP
- Integer---The Constant Field label Positioning flag and the Information Label Positioning flag allow you to change the X and Y centering options of the text so that you can place any corner or the center of the label at the point specified by (CFX, CFY) or (ILX, ILY). The illustration shows the positions and values of CFP and ILP for a label.
If the dot in the illustration represents the point (ILX, ILY), the "ILP=" value shows how the label is drawn relative to the point. If the dot in the illustration represents the point (CFX, CFY), the parameter CFP produces the same results as the "ILP=" values shown.
Lines 1 and 2 of the ccpcfx.f code segment place the constant field label in the upper left corner of the contour rectangle. We know that the upper left corner of the contour rectangle has the coordinates (0.0, 1.0), so we set CFX=0.0, and CFY=1.0.
To avoid positioning the label outside the contour rectangle, line 3 sets CFP=2 so that the label has its upper left corner at the point (CFX, CFY).
- Using the ccpcfx example, move the constant field label to below the lower right corner of the plot so that it is positioned in the same place as an information label.
- Using the ccpila example, move the information label to the top right corner of the plot.
High and low labels have three placement control parameters: HLO (the overlap flag), HLX, and HLY (the X and Y search radius parameters). These parameters allow you to control how closely together labels are positioned, and whether or not they are allowed to overlap other labels or the contour rectangle.
1       CALL CPSETI ('HLX - HIGH/LOW SEARCH RADIUS IN X', 2)
2       CALL CPSETI ('HLY - HIGH/LOW SEARCH RADIUS IN Y', 2)
3       CALL CPSETI ('HLO - HIGH/LOW LABEL OVERLAP FLAG', 0)
4       CALL CPRECT (Z, M, M, N, RWRK, LRWK, IWRK, LIWK)
5       CALL CPBACK (Z, RWRK, IWRK)
6       CALL CPCLDR (Z, RWRK, IWRK)
7       CALL CPLBDR (Z, RWRK, IWRK)
      CALL CPSETI ('HLX', ihlx)
      CALL CPSETI ('HLY', ihly)
      CALL CPSETI ('HLO', ihlo)
- HLX and HLY
- Integer---The High/Low search radius in X and High/Low search radius in Y parameters specify the search radius for high and low values in a contour field. Since data points are searched, the smallest search radius in either the X or Y direction is one data point. For example, if Z(I,J) were a potential low, and the search radius in each direction were 1, then Z(I-1,J-1), Z(I-1,J), Z(I1,J+1), Z(I,J-1), Z(I,J+1), Z(I+1,J-1), Z(I+1,J), and Z(I+1,J+1) would be compared against Z(I,J) to see if any were smaller.
- >0 Specifies the search radius for highs and lows.
- <=0 Conpack picks a reasonable value. HLX is set to approximately 1/8*ZDM, where ZDM is the number of data points or interpolated data points in the X direction. Similarly, HLY is set to approximately 1/8*ZDN, where ZDN is the number of data points or interpolated data points in the Y direction. 2<=HLX, HLY<=15.
- HLO
- Integer---The High/Low label Overlap flag determines what objects high and low labels can overlap. You can produce combined effects by adding any of the following values together. For example, to eliminate high and low labels that overlap the information label and to eliminate high and low labels that overlap each other, set HLO = 1 + 2 = 3.
- 0 Labels are not checked for any kind of overlap.
- 1 High and low labels that overlap the information label are omitted.
- 2 High and low labels that overlap other high and low labels are omitted.
- 4 High and low labels that overlap the contour rectangle are omitted.
- 8 High and low labels that overlap the contour rectangle are moved inwards enough to eliminate overlap. (HLO=4 has precedence over HLO=8.)
The best way to think about HLX and HLY is that they describe a rectangle 2*HLX units wide and 2*HLY units high, where a unit is the distance between your data points. All data points within that rectangle are compared with the center point; and if all the points are lower or higher than the center point, then it is marked as a local high or low.
Lines 1 and 2 of the ccphl.f code segment set the search area for highs and lows to be a square 2 units wide by 2 units high. All points next to the center point are checked to see if they are higher or lower than the center. By doing this, we make sure that every possible high or low is marked. Line 3 turns off checking to see if high and low labels overlap with anything else. Lines 4 through 7 draw contours with the familiar calls.
- Correct the ccphl example so that it gives a single high label and a single low label for the plot.
The constant field found flag, CFF, is set to a nonzero value if CPRECT, CPSPS1, or CPSPS2 detects a constant field. Users may not set this parameter.
1       CALL CPRECT (Z, M, M, N, RWRK, LRWK, IWRK, LIWK)
2       CALL CPGETI ('CFF - CONSTANT FIELD FOUND FLAG', ICFF)
3       IF (ICFF .NE. 0) GOTO 101
4          CALL CPBACK (Z, RWRK, IWRK)
5          CALL CPLBDR (Z, RWRK, IWRK)
6          CALL CPCLDR (Z, RWRK, IWRK)
7  101  WRITE (6,*) 'The field is constant.'
8       STOP
9       END
CALL CPGETI ('CFF', icff)
- CFF
- Integer---The Constant Field Found flag is nonzero if CPRECT, CPSPS1, or CPSPS2 finds a constant field. You cannot set this parameter, and its default value is zero.
Line 2 of the ccpcff.f code segment retrieves CFF so that we can check it in line 3 to see if a constant field was found. In this case, when a constant field is found, we exit the program. You could use this option to detect errors in your program or data, then conclude with a graceful exit.
This is one of the most complex subjects in Conpack. Not only does it require knowledge of most of the preceding sections on Conpack, it also relies heavily on understanding both Areas and Ezmap. In this section, we develop a subroutine that can be easily modified to draw a "default" overlay of contours on a map with color fill.
----------------------------------------------------------
    1.  Open GKS
 *  2.  Set window and viewport
    3.  Put in titles and other labels
 *  4.  Set up general parameters
 *  5.  Set up area maps
 *  6.  Initialize Conpack
 *  7.  Force Conpack to choose contour levels if necessary
 *  8.  Modify Conpack-chosen parameters
 *  9.  Draw labels
 *  10.  Draw background
 *  11.  Draw contour lines
    12.  Call FRAME
    13.  Close GKS

----------------------------------------------------------
* Steps discussed in this section.
In Areas section "Ar 2. Initializing Areas," Ezmap module "Mp 4.3 Initialize Ezmap with Areas," and Conpack module "Cp 5.3 Initialize Conpack with Areas," we discuss each of the routines that must be called to initialize Conpack, Ezmap, and Areas together. This module does not introduce any new routines, it simply describes how to use all the necessary subroutines together.

1       EXTERNAL FILL
2       EXTERNAL MASK
3
4       CALL GSFAIS (1)
5       CALL ARINAM (MAP, LMAP)
6       CALL MPSETR ('GR - GRID SPACING', 0.)
7       CALL MPSETC ('OU - OUTLINE DATA FLAG', 'CO')
8       CALL MAPROJ (PROJ, PLAT, PLON, 0.0)
9       IF (PROJ .EQ. 'SV') CALL MPSETR ('SA - SATELLITE VIEW DISTANCE', 10.)
10      CALL MAPSET ('CO', RLATMN, RLONMN, RLATMX, RLONMX)
11      CALL MAPINT
12      CALL MAPBLA (MAP)
13      CALL CPSETI ('SET - DO-SET-CALL FLAG', 0)
14      CALL CPSETI ('MAP - MAPPING FLAG', 1)
15      CALL CPSETR ('ORV - OUT-OF-RANGE VALUE', 1.E12)
16      CALL CPSETR ('XC1 - X COORDINATE AT INDEX 1', RLONMN)
17      CALL CPSETR ('XCM - X COORDINATE AT INDEX M', RLONMX)
18      CALL CPSETR ('YC1 - Y COORDINATE AT INDEX 1', RLATMN)
19      CALL CPSETR ('YCN - Y COORDINATE AT INDEX N', RLATMX)
20      CALL CPSETI ('LLP - LINE LABEL POSITIONING', 0)
21      CALL CPSETI ('HLB - HIGH/LOW LABEL BOX FLAG', 2)
22      CALL CPSETI ('HLC - HIGH/LOW LABEL COLOR INDEX', 1)
23      CALL CPRECT (ZREG, MREG, MREG, NREG, RWRK, LRWK, IWRK, LIWK)
24      CALL CPCLAM (ZREG, RWRK, IWRK, MAP)
25      CALL CPLBAM (ZREG, RWRK, IWRK, MAP)
The colcon example performs both filling and masking, so you need to declare the filling and masking routines external; lines 1 and 2 of the colcon.f code segment do this. Line 4 sets the fill area option to solid. GKS is opened in the main program (not shown here) to finish calling the routines to initialize GKS.
Line 5 initializes Areas with a call to ARINAM. This is the only routine required for initializing Areas.
Lines 6 through 11 are the Ezmap routines needed to initialize our plot. In this case, line 6 turns off grid lines. Line 7 turns on continental outlines. Lines 8 and 9 choose a projection and give a default satellite height in case the satellite projection is chosen. Line 10 sets the corners of the map to be the same as the corners of our contour data, as it appears in lines 16 through 19. Line 11 initializes our geographic map, and line 12 adds those lines to the area map.
You may want to draw or fill contours over a geographic map with no masking over geographic regions. In cases like this, it is not a good idea to call MAPBLA and add the geographic map to the area, map because adding the geographic map to the area map is enormously expensive, both in memory (since the area map has to be at least 150,000 words) and in CPU time.
Lines 13 through 23 set up various Conpack options then initialize Conpack. Because MAPINT makes a call to SET, you need to tell Conpack to honor that call; line 13 does this. Line 14 tells Conpack that we have lat/lon data, and lines 16 through 19 set the minimum and maximum latitude and longitude data locations. Remember that longitude is the X direction and latitude is the Y direction.
Since colors denote the contour level values in this example, line 20 turns off line labeling. Lines 21 and 22 control the high/low label box fill and color options. Line 23 finally initializes Conpack, then lines 24 and 25 add the contours and the labels to the area map.
Note: This example does not use real data.
In Areas module "Ar 3.3 Writing
a masking or line-drawing routine," Ezmap module "Mp 4.6 Grid lines with masking:
Writing a masking routine," and Conpack module "Cp 5.6 Masking areas: Box masking
routines," we discuss writing and using various masking
routines. This module expands on the Conpack masking routine CPDRPL to
create a routine that masks contour lines over both labels and land
masses. We also discuss the ordering of the calls that fill and draw
in this program.
1       EXTERNAL MASK
2       CALL ARSCAM (MAP, XWRK, YWRK, NWRK, IAREA, IGRP, NOGRPS, FILL)
3       CALL MAPLOT
4       CALL CPLBDR (ZREG, RWRK, IWRK)
5       CALL CPCLDM (ZREG, RWRK, IWRK, MAP, MASK)
6
7       SUBROUTINE MASK (XWRK, YWRK, NWRK, IAREA, IGRP, NGRPS)
8       INTEGER IAREA(NGRPS), IGRP(NGRPS)
9       REAL XWRK(NWRK), YWRK(NWRK)
10
11      IDMAP = -1
12      IDCONT = -1
13      DO 10, I=1, NGRPS
14          IF (IGRP(I) .EQ. 1) IDMAP = IAREA(I)
15          IF (IGRP(I) .EQ. 3) IDCONT = IAREA(I)
16  10  CONTINUE
17      IF (NWRK .LT. 2) RETURN
18      IF ((IDMAP .GT. 0).AND.(IDCONT .GT. 0).AND.(MAPACI(IDMAP) .EQ. 1)) THEN
19          CALL CURVED (XWRK, YWRK, NWRK)
20      ENDIF
21      RETURN
22      END
- MASK
- Subroutine---A user-supplied external subroutine to process polylines resulting from masking the generated contour lines and other edges against the area map. The routine that calls CPCLDM must declare MASK as external.
- MASK is called repeatedly and must have the following form:
      SUBROUTINE MASK (XCS, YCS, NCS, IAREA, IGRP, ISIZ)
      DIMENSION XCS(*), YCS(*)
      DIMENSION IAREA(*), IGRP(*)
- (code to process polyline defined by arguments)
      RETURN
      END
- The arrays XCS and YCS hold the X and Y coordinates of NCS points defining a polyline that is to be considered for drawing. For each I such that 1<=I<=ISIZ, IAREA(I) is the area identifier for the area in which the polyline lies, relative to the area identifier group IGRP(I). The X and Y coordinates are all NDCs, and you can assume that the appropriate SET call has been made. If it is decided to draw the line, it may be done with a call to the SPPS routine CURVE, to the Dashline routine CURVED, or to the GKS routine GPL.
- If the only object of using CPCLDM is to avoid drawing contour lines through label boxes, then the Conpack routine CPDRPL may be used for MASK. In the subroutine that calls CPCLDM, insert the declaration EXTERNAL CPDRPL, and then use CPDRPL for the last argument.
Examine the CPDRPL routine and note that label boxes always have negative area identifiers. By refusing to draw contour lines over areas with nonpositive areas, we can be sure that we don't draw contour lines over label boxes. Also, since we want to draw contour lines over the ocean, we can pick out the oceans using the MAPACI function.
Lines 7 through 9 of the colcon.f code segment set our subroutine call and variables as specified by the CPCLDM documentation. Lines 11 and 12 initialize storage variables for the geographic map and contour area identifiers respectively. Lines 13 through 16 check each group identifier, and if it's one of the two groups we're interested in, then we retrieve the area identifier for that group. Line 20 protects against trying to draw points with a line-drawing routine. Line 18 checks to see if we are over the geographic map, over the contour area, and over the ocean. If so, then line 19 draws the contour line segment.
Note that our contouring routine first fills contours (line 2), second draws the map outlines (line 3), then draws labels and masked contour lines (lines 4 and 5). You must do the filling first because if you first draw lines and then fill over them, they become invisible. By calling MAPLOT to draw the continental outlines before filling the label boxes, we are using layering to effectively mask out geographic lines that run through the label boxes. This is the only way to do this because there is currently no way to mask the geographical outlines without modifying Ezmap source code.
Note: This example does not use real data.
- Using the colcon example, draw contour lines over land and fill them over water.
Filling specific contour levels and geographic areas is yet another application of the APR subroutine in ARSCAM.
Examples of fill routines are presented in Areas module "Ar 3.5 Writing an area-fill
routine," Ezmap module "Mp
4.6 Grid lines with masking: Writing a masking routine," and
Conpack module "Cp 5.6 Masking areas:
Box masking routines." The difference between these previously
discussed routines and this one is that we want to fill regions based
on both geographic and contour information.

1       SUBROUTINE FILL (XWRK, YWRK, NWRK, IAREA, IGRP, NGRPS)
2       DIMENSION XWRK(*), YWRK(*), IAREA(*), IGRP(*)
3
4       IDMAP = -1
5       IDCONT = -1
6       DO 10, I=1, NGRPS
7          IF (IGRP(I) .EQ. 1) IDMAP = IAREA(I)
8          IF (IGRP(I) .EQ. 3) IDCONT = IAREA(I)
9   10  CONTINUE
10      IF (NWRK .LE. 3) RETURN
11      IF ((IDMAP .GT. 0) .AND. (IDCONT .GT. 0)) THEN
12          IF (MAPACI(IDMAP) .EQ. 1) THEN
13             CALL GSFACI (IDCONT + 2)
14             CALL GFA (NWRK-1, XWRK, YWRK)
15          ELSE
16             CALL GSFACI (2)
17             CALL GFA (NWRK-1, XWRK, YWRK)
18          ENDIF
19      ENDIF
20      RETURN
21      END
Lines 1 and 2 of the colcon.f code segment set up the fill routine as specified by ARSCAM. Lines 4 and 5 initialize the geographic and contour area identifier variables. Lines 6 through 9 check each group identifier: if it is a geographic group, the area identifier is stored in IDMAP; if it is a contour group, the area identifier is stored in IDCONT.
Line 10 checks to see if the fill area is defined by two or fewer points, in which case we return to ARSCAM. Line 11 checks to see if we are over the geographic map, the area to be contoured, and not over a label. Line 12 checks to see if we are over the ocean, and if we are, the area is filled according to contour level value in lines 13 and 14. If we aren't over the ocean, lines 16 and 17 fill the area with gray.
Note: This example does not use real data.
- Run the colcon example using the UNIX command time. Then comment out the call to MAPBLA and modify FILL so that it fills the entire plot, and time it again.
- Modify the colcon example so that contour levels are filled only over land regions.
This module shows an example of how to fill contours over a polar projection of the globe. Filling contours over a polar projection requires all the same steps discussed in the previous three modules.
1       EXTERNAL COLRAM
2       EXTERNAL COLRCL
3       EXTERNAL COLRLL
4       CALL ARINAM (IAMA, LAMA)
5       CALL MAPPOS (.03, .97, .01, .95)
6       CALL MAPROJ ('ST', 90., 0., 0.)
7       CALL MAPSET ('AN', 90., 90., 90., 90.)
8       CALL MAPINT
9       CALL MAPBLA (IAMA)
10      CALL CPSETI ('SET - DO-SET-CALL FLAG', 0)
11      CALL CPSETI ('MAP - MAPPING FLAG', 1)
12      CALL CPSETR ('XC1 - X COORDINATE AT INDEX 1', -180.)
13      CALL CPSETR ('XCM - X COORDINATE AT INDEX M', +180.)
14      CALL CPSETR ('YC1 - Y COORDINATE AT INDEX 1',  -90.)
15      CALL CPSETR ('YCN - Y COORDINATE AT INDEX N',  +90.)
16      CALL CPSETI ('CLS - CONTOUR LEVEL SELECTION FLAG', 1)
17      CALL CPSETR ('CMN - CONTOUR LEVEL MINIMUM', 0.)
18      CALL CPSETR ('CMX - CONTOUR LEVEL MAXIMUM', 110.)
19      CALL CPSETR ('CIS - CONTOUR INTERVAL SPECIFIER', 10.)
20      CALL CPSETR ('ORV - OUT-OF-RANGE VALUE', 1.E12)
21      CALL CPRECT (ZDAT, NLON, NLON, NLAT, RWRK, LRWK, IWRK, LIWK)
22      CALL CPCLAM (ZDAT, RWRK, IWRK, IAMA)
23      CALL ARSCAM (IAMA, XCRA, YCRA, NCRA, IAIA, IGIA, 10, COLRAM)
24      CALL MAPGRM (IAMA, XCRA, YCRA, NCRA, IAIA, IGIA, 10, COLRLL)
25      CALL MAPSTC ('OU - OUTLINE DATA FLAG', 'CO')
26      CALL MAPLOT
27      CALL CPCLDM (ZDAT, RWRK, IWRK, IAMA, COLRCL)
In lines 1 through 3 of the ccppole.f code segment, the area filling routine, COLRAM, the contour line masking routine, COLRCL, and the grid line masking routine, COLRLL are declared to be external so that they won't be confused with variables when their names are passed to ARSCAM, CPCLDM, and MAPGRM respectively.
Line 4 initializes the area map, and lines 5 through 8 set up and initialize the geographic map. Line 9 adds the geographic outlines to the area map. Line 10 tells Conpack that the SPPS routine SET has been called, and line 11 tells Conpack that we're overlaying contours over a geographic map. Line 20 tells Conpack that values off the map projection are not to be contoured.
Lines 12 though 15 set up the limits of the contour data over the globe, and lines 16 through 19 set the contour level values. Line 21 initializes Conpack. Line 22 adds contour lines to the area map. Line 23 color-fills the map. Line 24 draws grid lines over the ocean but not land. Line 26 draws the geographic outlines over the plot, and line 27 outlines the contour lines.
Notice that the areas are filled first, and then outlines are drawn on top. This prevents your outlines from being overwritten by the area filling.
The most frequent mistake that users make with this kind of plot is to forget that the data along the right edge of their global grid must equal the data along the left edge. When this mistake is made, they will either have a gap between the meridians into which those edges project or, if they improperly map those edges into the same meridian, the contours there won't fit together. Also, if the values along the top edge all map into the North Pole, they must be equal to one another. Similarly, if the values along the bottom edge all map into the South Pole, they must all be equal.
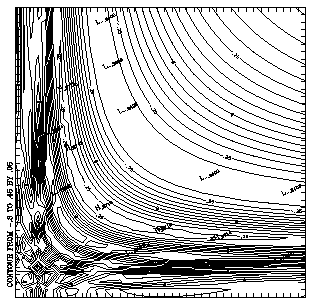
This section contains information about frequently requested functionality that doesn't fit neatly into the preceding discussion of contouring. This section provides examples of smoothing contours, drawing hachures (tick marks on contours to indicate slope), using a cell array technique for color-filling plots with dense data, and a demonstration of how to make a movie.
Conpack supports two different methods for smoothing contour lines. By setting the Conpack smoothing parameter T2D, you can force Conpack to either use cubic splines under tension to smooth curves or interpolate between existing data points to smooth curves. You can generate closely spaced data points with an interpolation package, or you can use CPSPS1 or CPSPS2 on gridded data.
1       CALL CPSETR ('T2D - TENSION ON 2-DIMENSIONAL SPLINES', .0001)
2       CALL CPRECT (ZDAT, M, M, N, RWRK, LWRK, IWRK, LWRK)
3       CALL ARINAM (IAMA, LMAP)
4       CALL CPCLAM (ZDAT, RWRK, IWRK, IAMA)
5       CALL ARSCAM (IAMA, XCRA, YCRA, LWRK, IAREA, IGRP, 2, FILL)
      CALL CPSETR ('T2D', t2d)
      CALL CPSETI ('PIC', ipic)
      CALL CPSETR ('SSL', ssl)
- T2D
- Real---The Tension on 2-Dimensional splines parameter controls how much smoothing is done.
- 0. No 2-D smoothing occurs. This is the default.
- >0. T2D is used as the tension on cubic splines used for smoothing. Smoothing is done after mapping. This option generates more accurate contours than the default case.
- <0. ABS(T2D) is used as the tension on cubic splines. In this case, smoothing is done before mapping requested by the MAP flag is done. This option can reduce CPU time when both smoothing and mapping are required.
- PIC
- Integer---the Point Interpolation flag for Contours parameter specifies the number of points to interpolate between each pair of points defining a segment of a contour line, prior to any mapping requested by the MAP parameter.
- 0 No points interpolated. This is the default.
- >0 Normally used only if MAP<>0 and T2D=0. This maps straight line segments of contour lines more nearly correctly into curved line segments on a background. If T2D<>0, the interpolated points are used and the smoothed line will be constrained to pass through them.
- <0 Normally used only if MAP<>0 and T2D=0. ABS(PIC) points are interpolated, but the interpolated points are not, in general, used to draw the line segment. This does a finer search for changes in visibility to locate more carefully which points are outside the Ezmap transformation range.
- SSL
- Real---The Smoothed Segment Length parameter specifies the distance between points used to draw the curves generated by 2-D smoothing; it is expressed as a fraction of the width of the window in the coordinate system in which smoothing is being done. By default, SSL=.01.
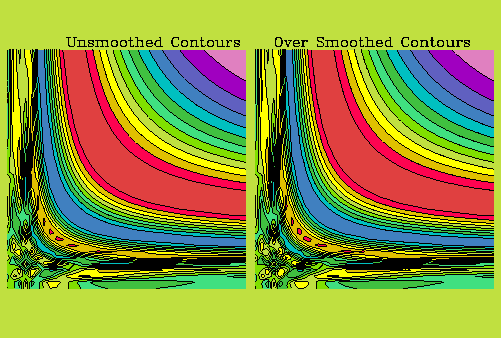
Line 1 of the ccpt2d.f code segment smooths contour lines by setting the T2D parameter. Set T2D before contour lines are added to the area map (if one is used) or before contour lines are drawn. Small T2D values (like .0001) give very smooth curves, and large values like 50.0 give barely smoothed or polygonal curves.
There are two symptoms of too much smoothing using the T2D parameter. First, when low tension is set (small T2D values), it is possible to get loops in the contour line. Second, since each contour line is smoothed individually, it is possible for contour lines to overlap when using T2D. It is possible to minimize these problems by setting PIC so that points are interpolated between each data point before smoothing. This will constrain the smoothed curves to more closely approximate the original polylines.
When contour lines cross, the area identifiers get confused. This can cause colors to mix unpredictably in color-filled plots (this caused the background to be green rather than black in the ccpt2d example). To avoid crossed contour lines, you can use CPSPS1 or CPSPS2 to do 3-D smoothing. CPSPS1 and CPSPS2 use bicubic splines under tension and then sample the generated surface to get a dense array of data, which is returned to you for contouring. This is CPU- and memory-intensive. However, this method will not generate crossing contours or loops in contour lines.
The data in the dense array returned by CPSPS1 and CPSPS2 may have a larger range than the original data. For example, if you are measuring water temperature that is never below 0 degrees Celsius, you may discover your interpolated array has values less than 0 after calling CPSPS1 or CPSPS2. In these cases, you should either perform your own inter-polation or modify the contents of the interpolated array to fit your restrictions before contouring.
- Using ccpt2d.f, set T2D=.0005, and observe what happens.
- Modify ccpt2d.f so that it smooths the data with CPSPS1. Notice how the contour lines change.
Hachuring is the process of drawing "hachures" or short line segments that indicate the direction of the slope. Usually, hachures are drawn on the downslope side of a contour line and are perpendicular to it, but Conpack also allows you to draw hachures on the upslope side of the contour line.
1       CALL CPSETI ('HCF - HACHURE FLAG', 2)
2       CALL CPSETR ('HCS - HACHURE SPACING', .05)
3       CALL CPSETR ('HCL - HACHURE LENGTH', .01)
4       CALL CPRECT (ZREG, M, M, N, RWRK, LRWK, IWRK, LIWK)
5       CALL CPBACK (ZREG, RWRK, IWRK)
6       CALL CPCLDR (ZREG, RWRK, IWRK)
      CALL CPSETI ('HCF', ihcf)
      CALL CPSETR ('HCS', hcs)
      CALL CPSETR ('HCL', hcl)
- HCF
- Integer---The HaChure Flag determines which lines are hachured as follows:
- 0 Hachuring is off. This is the default.
- 1 All contours are hachured.
- 2 Closed contours are hachured only if the interior of the contour is downslope. Open contours are all hachured.
- 3 Closed contours are hachured only if the interior of the contour is downslope. Open contours are not hachured.
- 4 Closed contours are hachured only if the interior of the contour is downslope. Open contours are hachured only if the interior of the contour is downslope, where "interior" is defined by computing the total change in direction along the contour. If that total is positive, the interior is to the left; if that total is negative, the interior is to the right.
- <0 Each value has the same effect as ABS(HCF), except that the word "downslope" above is replaced by the word "upslope."
- HCS
- Real---The HaChure Spacing parameter sets hachure spacing as a fraction of the width of the viewport. This is the distance between hachures along a contour line. The default value is .01.
- HCL
- Real---The HaChure Length parameter sets the length of hachures as a fraction of the width of the viewport. If HCL>0, then hachures are drawn on the downslope side of the contour. If HCL<0, then hachures are drawn on the upslope side of the contour. The default value is .004.
Line 1 of the ccphcf.f code segment shows that hachuring is set by setting the HCF parameter. Line 2 shows how to change hachure spacing, and line 3 demonstrates how to change the hachure length. Since these parameters cannot be applied to individual lines, it is best to call them before initializing Conpack.
Occasionally when using hachuring, it may be necessary to increase the value of RWC so that the hachuring routine works with all of each contour line. Otherwise, contours may be marked incorrectly.
- Try out the other hachuring options using example ccphcf.f.
If you have very dense data that you want to color fill, it is usually much faster to make a cell array for the plot rather than contouring it. This method has better accuracy for the "contours," and it can take significantly less CPU time to generate.
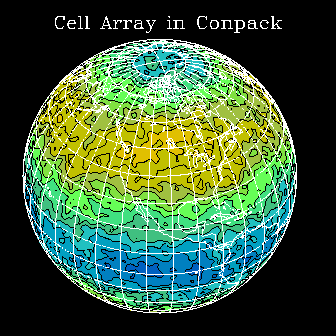
1       CALL COLOR
2       CALL SETMAP ('SV', 40., -105.)
3       CALL SETCTR (0, 1, -180., 180., -90., 90., 1.E36)
4       CALL CPRECT (ZDAT, NLON, NLON, NLAT, RWRK, LRWK, IWRK, LIWK)
5       CALL CPCICA (ZDAT, RWRK, IWRK, ICRA, ICAM, ICAM, ICAN, 0., 0., 1., 1.)
6       CALL GCA (CFUX(0.), CFUY(0.), CFUX(1.), CFUY(1.), ICAM, ICAN, 1, 1,
       + ICAM, ICAN, ICRA)
7       CALL CPCLDR (ZDAT, RWRK, IWRK)
8       CALL MAPLOT
9       CALL MAPGRD
      CALL CPCICA (ZDAT, RWRK, IWRK, ICRA, ICA1, ICAM, ICAN, XCPF, YCPF,
     +             XCQF, YCQF)
- ZDAT
- Real array, Workspace---The array of data points which must not have been modified since the last call to CPRECT, CPSPS1, or CPSPS2.
- RWRK
- Real array, Workspace---The real workspace array which must not have been modified since the last call to CPRECT, CPSPS1, or CPSPS2.
- IWRK
- Integer array, Workspace---The integer workspace array which must not have been modified since the last call to CPRECT, CPSPS1, or CPSPS2.
- ICRA(ICA1,n)
- Integer array, Input or Output---The cell array. On input, this array should be zeroed. On output, it contains color indices of the the cell array.
- ICA1
- Integer, Input---The first dimension of the Fortran array ICRA. Make ICA1 fairly large to avoid having your cells show. A good minimum value for ICA1 is 200.
- ICAM
- Integer, Input---The first dimension of the cell array. This is the first dimension of the portion of the array that will be used.
- ICAN
- Integer, Input---The second dimension of the cell array. ICAN<=n, where n is the dimension of the array declared in the DIMENSION or INTEGER statement.
- XCPF, YCPF
- Real, Input---The coordinates, in NDCs, of the corner of the area into which cell (1, 1) of the cell array maps.
- XCQF, YCQF
- Real, Input---The coordinates, in NDCs, of the corner of the area into which cell (ICAM, ICAN) of the cell array maps.
Line 1 of the ccpcica.f code segment calls a user-defined subroutine to generate a color table. Line 2 calls a second user-defined subroutine where all the Ezmap options are set to draw a map. Line 3 calls another user-defined subroutine to set the necessary general contouring options.
Line 4 initializes Conpack so that line 5 can generate a cell array. Line 6 plots the cell array onto the map by using the functions CFUX and CFUY to determine the user coordinates of the corners of the plot. Line 7 outlines the contour lines using a call to CPCLDR, and line 8 outlines the map. Line 9 draws the grid lines on the map.
- Draw a contour cell array without a map behind it.
When making movies of contours over a globe, people sometimes have trouble organizing their code to minimize CPU time. This module demonstrates how to use Conpack, Ezmap, and Areas in conjunction with the Gflash utility to make a movie. The Gflash utility allows you to create CGM segments or partial pictures, and then overlay them. The code segment from the ccpmovi example creates a single map image, then plots several different sets of contour data over the map.
There are four Gflash routines. GFLAS1 initiates storage of plotting instructions into a disk file. GFLAS2 terminates the storage of plotting instructions to disk and resumes putting plotting instructions to the metafile output stream. GFLAS3 inserts the plotting instructions saved on disk into the output stream. GFLAS4 allows the user to access a disk file of plotting instructions generated with a GFLAS1 and GFLAS2 sequence in a previous job for use in a GFLAS3 call.
1       CALL GOPKS (6, IDNUM)
2       CALL GOPWK (1, 2, 1)
3       CALL GACWK (1)
4       CALL GSCLIP (0)
5       CALL GSASF (IASF)
6       CALL COLOR
7       CALL GOPWK (9, 1, 3)
8       CALL GFLAS1 (0)
9       CALL DRWMAP ('SV', 40., -105.)
10      CALL GFLAS2
11      CALL SETCTR (0, 1, -180., 180., -90., 90., 1.E36)
12      DO 30, I=1, N
13          CALL MKDAT (I, ZDAT, NLON, NLAT)
14          CALL DRWCTR (ZDAT, NLON, NLAT)
15          CALL GFLAS3 (0)
16          CALL FRAME
17  30  CONTINUE
18      CALL GCLWK (9)
19      CALL GDAWK (1)
20      CALL GCLWK (1)
21      CALL GCLKS
      CALL GFLAS1 (IDNUM)
      CALL GFLAS2 (IDNUM)
      CALL GFLAS3 (IDNUM)
      CALL GFLAS4 (IDNUM, FNAME)
- IDNUM
- Integer, Input---A buffer identifier. This identifier must be between 0 and 99 inclusive, and is used by GFLAS3 to identify the buffer to be added to the CGM file. GFLAS1 automatically assigns the name GNFBxx (GKS New Flash Buffer) to the file that will receive subsequent plotting instructions, where xx is the integer value of IDNUM.
- FNAME
- Character expression, Input---The name of the file in which plotting instructions are stored.
Before using Gflash, you must open GKS. Once GKS is open, you can set GKS options (such as clipping and color tables shown in lines 4 and 6 of the ccpmovi.f code segment). When a segment is copied to a GKS workstation (including a CGM file), all attribute settings (except color table settings) in effect at the time of a segment's creation will be stored in the segment.
Lines 2 and 3 of the ccpmovi.f code segment open and activate a CGM workstation to which the movie file will be written. Before creating your first segment, you must open a workstation with workstation type 3. Line 7 opens workstation 9 to write to unit 1, using workstation type 3. You can use any workstation number and any unit number that are not already being used.
Line 8 begins writing our segment to buffer 0, and the file GNFB00 is created in the current working directory to hold the segment. Line 9 calls a user-supplied routine to draw a map of the globe, and line 10 quits writing to buffer 0.
Line 11 sets up the necessary contour options that will be the same for every plot, and line 13 creates a different dataset for each plot. The user routine DRWCTR plots these datasets in line 14. The contours here are being drawn directly to the default CGM file, gmeta.
Line 15 overlays the global map on the contours, and line 16 closes the frame. Line 18 is required to close the Gflash workstation, and the number 9 must correspond to the workstation identifier number set in line 7. Lines 19 and 20 deactivate and close the CGM workstation, and line 21 closes GKS.
For more complete information about Gflash, GKS workstations, and CGM buffer files, please see Chapter 6 "What you need to know about GKS workstations" in the NCAR Graphics Fundamentals guide.
Previous Chapter Tutorial Home Next Chapter