Cp 4. Conpack Contour line basics

Previous Chapter          Tutorial Home          Next Chapter
The contour line basics section covers drawing lines and setting contour line attributes (like line pattern, color, thickness, and level values) for simple line contour drawings and for contour drawings with filled contour levels.

In the Conpack functional outline, note that setting contour line attributes and drawing the lines may require you to set parameters in two places, and then call a contour drawing routine.

Conpack functional outline

----------------------------------------------------------
    1.  Open GKS                                             
    2.  Set window and viewport                              
    3.  Put in titles and other labels                       
 *  4.  Set up general parameters                            
    5.  Set up area maps                                     
    6.  Initialize Conpack                                   
 *  7.  Force Conpack to choose contour levels if necessary  
 *  8.  Modify Conpack-chosen parameters                     
    9.  Draw labels                                          
    10.  Draw background                                     
 *  11.  Draw contour lines                                  
    12.  Call FRAME                                          
    13.  Close GKS                                           
----------------------------------------------------------
* Steps discussed in this section.

Cp 4.1 Contour line basics

This section covers two issues: how to draw contour lines and what attributes you want to assign or change for one or more of those contour lines. In the next module, you can learn how to draw contour lines using CPCLDR. If you want to use the Areas utility to color-fill or pattern-fill your contour levels, you may not need to draw the contour lines with this routine. More information appears in section "Cp 5. Filling contour levels."

Contour line attributes

Discussion

If you want to change one or more contour level values, you must first decide if you want to change a value that Conpack chooses for you, or if you want to assign values to every contour level. After this choice is made, you change contour level values much the same as other contour line attributes.

To change a single contour line attribute, it is necessary to specify the contour line you want to modify, then set the appropriate Conpack parameters using the CPSETx routines.

Cp 4.2 Drawing contour lines

There are two contour-drawing routines in Conpack: CPCLDR and CPCLDM.

This module discusses the routine CPCLDR; it draws contour lines across the entire contour rectangle.

CPCLDM (the other routine) is discussed in the masking areas modules Cp 5.5 and Cp 5.6. CPCLDM is used with the Areas utility to draw contours over a specified region of the contour rectangle; it should be used with non-default contour line labels.
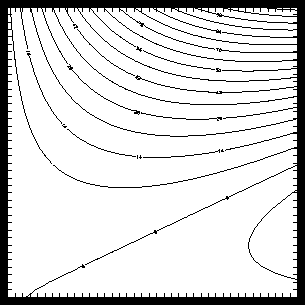
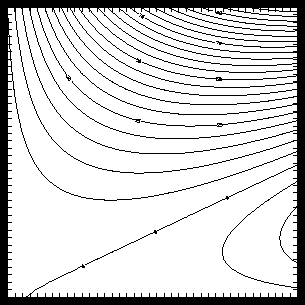
Basic contours

Code segment from ccpcldr.f

1       CALL CPRECT (Z, K, M, N, RWRK, LRWK, IWRK, LIWK)
2       CALL CPCLDR (Z, RWRK, IWRK)

Synopsis

      CALL CPCLDR (Z, RWRK, IWRK)

Arguments

All three arguments to the CPCLDR call are arrays used in the last call to CPRECT, CPSPS1, or CPSPS2. Don't change the contents of these arrays between calls to Conpack.

Z
Real array, Input---The data array.
RWRK
Real array, Workspace---The real work array.
IWRK
Integer array, Workspace---The integer work array.

Discussion

Line 1 of the ccpcldr.f code segment initializes Conpack with a call to CPRECT. This can also be done with CPSPS1 or CPSPS2. Line 2 draws the contour lines with CPCLDR. If you call CPCLDR after calling CPSPS1 or CPSPS2, make sure that you call it with the interpolated data array rather than with your original data array.

If you are using irregularly spaced data or sparse data, it is extremely important to pass your regularly spaced data array to CPCLDR. Otherwise, you will get incorrect results.

If your data all have the same values, in other words, if you have a constant data field, CPCLDR writes out a constant field message on your CGM and does not draw any contours.
Exercises

  1. Modify ccpcldr to use sparse gridded data.

Cp 4.3 Four methods of contour level selection

Conpack chooses contour levels only when they are needed, and not in the initialization subroutines. This feature allows you to use several methods to pick your contour levels. By default, Conpack attempts to choose about 16 "nice" levels. If these don't meet your needs, you can modify one or more Conpack-chosen levels, you can fix the number of levels that you get, or you can specify each contour level.

A "nice" contour plot

Discussion

There are four methods used to decide how many and which contour levels are drawn. By default, Conpack employs a rather complicated scheme using several parameters to choose "nice" contour level values. This scheme is discussed in the default contour level selection modules Cp 4.4 through Cp 4.6.

After Conpack chooses the contour level values, then you can change their values or even add new contour levels. You must first force Conpack to choose contour levels using CPPKCL, and then retrieve the number of contour levels before modifying the levels using the same parameters Conpack uses by default. Information about modifying the contour level values chosen by Conpack appears in the modifying Conpack-chosen levels modules Cp 4.7 and Cp 4.8.

The third method you can use to decide how many contour levels are drawn is to set CLS to the negative of the number of contour levels that you want. When this method is used, the minimum and maximum data values are located, and contours are drawn at n equal intervals over the range of the data. This method may produce contours at inconvenient or "ugly" values; this is discussed in module "Cp 4.9 Setting n equally spaced contour levels."

The most reliable way to get contours where you want them is to set all of them yourself, using the CLS, NCL, PAI, CLV, and CLU parameters. This method is discussed in module "Cp 4.10 Choosing your own contour levels."
Cp 4.4 Default contour level selection

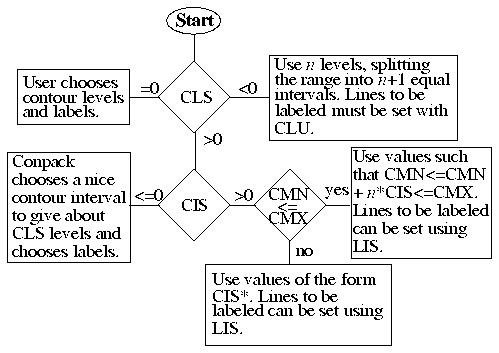
By default, contour levels in Conpack are chosen using the five parameters CLS, CIS, CMN, CMX, and CIT. These parameters are used to place contours at "nice" values for most sets of data. As with everything in Conpack, these parameters are completely configurable.

Default contour levels

Synopsis

      CALL CPSETI ('CLS', icls)

Arguments

CLS
Integer---The Contour Level Selection flag is critical to how contour levels are chosen. It not only determines how many contour levels are chosen, it also determines which contour level selection method is used. By default n=16.
0
Conpack does not pick contour levels at all; the current values of the parameters NCL, CLV, and associated arrays are not changed. They thus retain the values chosen by you, or by Conpack during a previous call. This option is used in module "Cp 4.10 Choosing your own contour levels."
-n
Where n is a positive integer, Conpack generates exactly n contour lines, splitting the range from the minimum field value to the maximum field value into n+1 equal intervals (contour levels). This option is discussed further in the modifying Conpack-chosen levels modules Cp 4.7 and Cp 4.8.
+n
By default, Conpack chooses contour intervals at base*k, where the base value is some nice value either chosen by Conpack or set with the CIS parameter, and k is an integer. A nice value for base is defined by the contents of CIT, and chosen in such a way as to give at least n contour levels. Using the default CIT, you may get as many as 2n levels. In other words, n<=kmaxkmin+1<=2n. This option is discussed further in the default contour level selection modules Cp 4.4 through Cp 4.6.
If CIS>0 and CMN>CMX (your contour field minimum is set greater than your contour field maximum), then Conpack uses values of the form CIS*k, where k is used as above. If CIS>0 and CMN<=CMX (your contour minimum is set less than or equal to your contour maximum), then Conpack uses values of the form CMN+CIS*k, where k is an integer greater than or equal to CMN and less than or equal to CMX. See module "Cp 4.6 Default contour level selection: Fixed contour intervals and labels."

Discussion

The flowchart shows how the contour level selection process hinges on the CLS parameter. If CLS=0, then Conpack assumes that you will choose contour levels. If CLS<0, then Conpack chooses ABS(n) equally spaced contour levels, splitting the range from the minimum field value to the maximum field value into n+1 equal intervals. If CLS>0, then CIS is used to differentiate between choosing "nice" contour levels and choosing levels with a specific interval.

Cp 4.5 Default contour level selection: Default intervals and labels

There are two ways to get a "nice" contour interval. You can either set it directly using the CIS parameter, or you can give Conpack some options using the CIT parameter.

Changing nice contour intervals

Code segment from ccpcit.f

1       DATA CIT /1., 2., 3., 4., 5., 6., 7., 8., 9., 0./
2       DATA LIT /2,  2,  2,  2,  2,  2,  2,  2,  2,  0/
3       CALL OPNGKS
4       DO 101, I=1, 10
5          CALL CPSETI ('PAI - PARAMETER ARRAY INDEX', I)
6          CALL CPSETR ('CIT - CONTOUR INTERVAL TABLE', CIT(I))
7          CALL CPSETI ('LIT - LABEL INTERVAL TABLE', LIT(I))
8  101  CONTINUE
9       CALL CPRECT (Z, K, M, N, RWRK, LRWK, IWRK, LIWK)
10      CALL CPBACK (Z, RWRK, IWRK)
11      CALL CPCLDR (Z, RWRK, IWRK)

Synopsis

      CPSETI ('PAI', n)
      CPSETR ('CIT', cit)
      CPSETI ('LIT', lit)

Arguments

PAI
Integer---The Parameter Array Index must be set to specify the array element that is to be changed. For example, if you want to change the third array element of CIT to 3.33, you would set PAI=3, then set CIT to 3.33.
CIT(10)
Real array---The Contour Interval Table parameter specifies what constitutes the "nice" value that Conpack is allowed to use as a contour interval; it can use values of the form "c times 10 to the power n", where c is one of the nonzero elements of CIT. (For example, if 2. occurs in CIT, it means that Conpack can use a contour interval of 2 or 20 or 200 or .2 or .02, and so forth.)
LIT(10)
Integer array---For each element of CIT, the associated element of the Label Interval Table parameter specifies how far apart the labeled levels are. The default contents of CIT and LIT are:
-----------------------
PAI  CIT(PAI)  LIT(PAI)  
-----------------------
1    1.0       5         
2    2.0       5         
3    2.5       4         
4    4.0       5         
5    5.0       5         
6    0.0       0         
7    0.0       0         
8    0.0       0         
9    0.0       0         
10   0.0       0         
-----------------------
Given the default values for CIT, we might get, in a given situation, a contour interval of 25, with every 4th level labeled, or a contour interval of 40, with every 5th level labeled. We could not get a contour level of 30, even though that might be desirable for more nearly the approximate number of levels desired.

Discussion

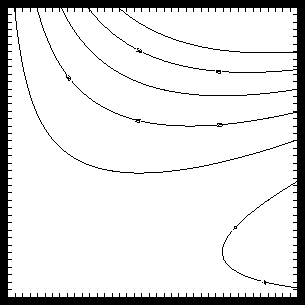
Lines 1, 2, and 4 through 7 of the ccpcit.f code segment set CIT so that "nice" values are the same as they were in the old CONREC routine. LIT is set up to force every other contour level to be labeled no matter what. Lines 9 through 11 draw contours normally. Notice that "nice" values in this plot are multiples of 7.

Line labels are discussed further in sections "Cp 7. General labels" and "Cp 6. Contour line labels."
Exercises

  1. Convince Conpack that increments of 33.3 are "nice" values.

Cp 4.6 Default contour level selection: Fixed contour intervals and labels

If the CLS parameter is set so that Conpack chooses contour levels (CLS>0), then it is possible to mandate a contour interval using the CIS parameter. Using the LIS parameter, it is also possible to specify which levels will get labels.

Fixed contour intervals

Code segment from ccpcis.f

1       CALL CPSETR ('CIS - CONTOUR INTERVAL SPECIFIER', 15.)
2       CALL CPSETI ('LIS - LABEL INTERVAL SPECIFIER', 2)
3       CALL CPSETR ('CMN - CONTOUR MINIMUM', -5.)
4       CALL CPSETR ('CMX - CONTOUR MAXIMUM', 75.)
5       CALL CPRECT (Z, K, M, N, RWRK, LRWK, IWRK, LIWK)
6       CALL CPBACK (Z, RWRK, IWRK)
7       CALL CPCLDR (Z, RWRK, IWRK)

Synopsis

      CALL CPSETR ('CIS', cis)
      CALL CPSETI ('LIS', lis)
      CALL CPSETR ('CMN', cmn)
      CALL CPSETR ('CMX', cmx)

Arguments

CIS
Real---The use of the Contour Interval Specifier parameter depends on the Contour Level Selection flag. When CLS>0, as discussed in module "Cp 4.4 Default contour level selection," a CIS value of:
<=0 Conpack chooses the contour interval using the CIT table to choose a "nice" base value. This is the default.
>0 Conpack uses CIS as the precise contour interval to be used. In this case, you may want to specify LIS to be some nonzero value to label every nth contour level. Labeling contour levels is discussed in sections "Cp 7. General labels" and "Cp 6. Contour line labels."
If CLS<=0, then CIS is ignored.
LIS
Integer---The use of the Label Interval Specifier parameter depends on CLS and CIS. When CLS>0 and CIS>0, then you must set LIS to specify the interval between labeled contour levels. By default, LIS=5, meaning every fifth contour is labeled.
Note: LIS is only used with the default contour line labels.
CMN
Real---The use of the Contour MiNimum and the Contour MaXimum value also depend on CLS and CIS. When CLS>0 and CIS>0 and CMN<=CMX, then contour levels are set at CMN, CMN+CIS, CMN+2*CIS, ... CMN+n*CIS<=CMX. By default, CMN=1.0 and CMX=0.0, so CMN>CMX.
CMX
Real---The Contour MaXimum value. By default, CMX=0.0.

Discussion

If you specify CLS=1, CIS=1/3, and LIS=3, you get contours at values like 1/3, 2/3, 3/3, 4/3, etc., and labels on contour lines with values like 1.0, 2.0, 3.0, and so on.

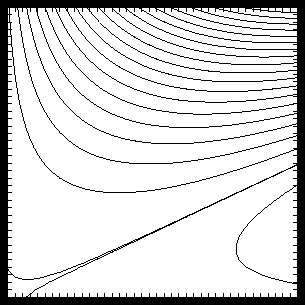
Line 1 sets CIS to 15., then line 2 specifies labels on every other line. Lines 3 and 4 set the low and high contour levels to -5. and 75. Contours are set to n*CIS+CMN (in this case -5., 10., 25., ...).

If you set CIS, you must also specify LIS to get contour line labels.
Exercises

  1. Using the ccpcis example, force Conpack to use a contour interval of 17., and to label every third contour level.
  2. Set CMN and CMX equal to 0.0, and describe what the results will be.

Cp 4.7 Modifying Conpack-chosen levels: Picking levels

Before you can modify Conpack-chosen contour levels, you must force Conpack to choose contour levels for you by using subroutine CPPKCL. CPPKCL is called by the first Conpack routine that needs a contour level; it is not called by CPRECT, CPSPS1, or CPSPS2.

Modified contour levels

Code segment from ccppkcl.f

1       CALL CPRECT (ZREG, K, M, N, RWRK, LRWK, IWRK, LIWK)
2       CALL CPPKCL (ZREG, RWRK, IWRK)
3       CALL CPGETI ('NCL - NUMBER OF CONTOUR LEVELS', NOCL)
4       CALL CPSETI ('NCL - NUMBER OF CONTOUR LEVELS', NOCL+1)
5       CALL CPSETI ('PAI - PARAMETER ARRAY INDEX', NOCL+1)
6       CALL CPSETR ('CLV - CONTOUR LEVEL VALUES', 0.0)

Synopsis

      CALL CPPKCL (ZREG, RWRK, IWRK)

Arguments

All three arguments to the CPPKCL call are arrays used in the last call to CPRECT, CPSPS1, or CPSPS2, the contents of which must not have been changed since that call. Since the dimensions of the following arrays are passed in common blocks, they are not shown here.

ZREG
Real array, Input---The densely gridded data array.
RWRK
Real array, Workspace---The real work array.
IWRK
Integer array, Workspace---The integer work array.

Discussion

Notice that you must call CPPKCL after the initialization routine (CPRECT, CPSPS1, or CPSPS2) because it depends on values set by the initialization routine. Also, since modifying contour level options chosen by Conpack must come after the initialization routines, this is one of the few times when you want to set parameters after the Conpack initialization routines. After parameters are chosen, contour lines and a background are drawn normally.

If the contour level selection parameter CLS is zero, CPPKCL does nothing. If the data field is found to be essentially constant by the initialization routines, (the constant field flag CFF<>0), then CPPKCL does nothing.

Calling CPPKCL sets the number of contour levels parameter NCL to the number of contour levels picked. Elements 1 through NCL of the parameter array CLV (contour level values) are set to the levels themselves. The Ith elements of the associated parameter arrays are set as follows:

-------------------------------------------------
CLU=1 or 3              Contour level use flag     
LLT=' ' (single blank)  Contour line label text    
CLD='$$$$$$$$$$$$$$$$'  Contour line dash pattern  
CLC=-1                  Contour line color         
LLC=-1                  Contour line label color   
CLL = 0.                Contour line line width    
-------------------------------------------------
Thus, after CPPKCL is called, the situation for each contour level is as follows:
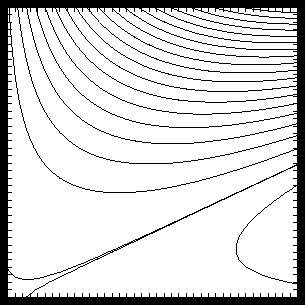
By resetting elements in these parameter arrays, you have complete control over each contour line.

Cp 4.8 Modifying Conpack-chosen levels: Changing the levels

After contour levels are chosen, there are two Conpack parameters that can be changed to modify the already chosen contour levels, number of contour levels (NCL), and contour level values (CLV).

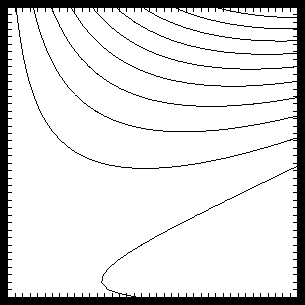
Modified contour levels

Code segment from ccppkcl.f

1       CALL CPRECT (ZREG, K, M, N, RWRK, LRWK, IWRK, LIWK)
2       CALL CPPKCL (ZREG, RWRK, IWRK)
3       CALL CPGETI ('NCL - NUMBER OF CONTOUR LEVELS', NOCL)
4       CALL CPSETI ('NCL - NUMBER OF CONTOUR LEVELS', NOCL+1)
5       CALL CPSETI ('PAI - PARAMETER ARRAY INDEX', NOCL+1)
6       CALL CPSETR ('CLV - CONTOUR LEVEL VALUES', 0.0)

Synopsis

      CALL CPSETI ('NCL', ncl)
      CALL CPSETI ('PAI', ipai)
      CALL CPSETR ('CLV', clv)
Arguments

NCL
Integer---The Number of Contour Levels value is used by many Conpack routines. The Conpack initialization routines set NCL to zero if CLS<>0. NCL is then set to some number of contour levels when contour levels are picked by CPPKCL or the contour-drawing routines.
PAI
Integer---The Parameter Array Index must be set to specify the array element that is to be changed. For example, if you want to change the third contour level value to 3.33, you would set PAI=3, then set CLV to 3.33.
CLV(NCL)
Real array---Each of the first NCL elements of the parameter array CLV (Contour Level Values) specifies a numerical value given to a contour level.

Discussion

Line 2 of the ccppkcl.f code segment forces Conpack to choose contour lines. Line 3 retrieves the number of contour lines. Line 4 increments the number of contour lines by 1. Lines 5 and 6 then add a zero-value contour line. The order in which the contour lines are stored in the CLV array doesn't matter, so it's easiest to add contour lines to the end of the array.

Exercises

  1. Using the ccppkcl example, add contour lines at 5.0 and +5.0, eliminating the contour level at 0.0.
  2. Remove every other contour line from the ccppkcl example.

Cp 4.9 Setting n equally spaced contour levels

After you learn what goes on in the default contour level selection process, it is relatively simple to make Conpack choose some number of equally spaced contour levels. All you need to do is to set the CLS parameter, and optionally, the contour minimum and maximum parameters (CMN and CMX respectively).

Ten equally spaced contour lines

Code segment from ccpncls.f

1       CALL CPSETI ('CLS - CONTOUR LEVEL SELECTION FLAG', -10)
2       CALL CPRECT (Z, M, M, N, RWRK, LRWK, IWRK, LIWK)
3       CALL CPBACK (Z, RWRK, IWRK)
4       CALL CPCLDR (Z, RWRK, IWRK)

Synopsis

      CALL CPSETI ('CLS', icls)

Arguments

CLS
Integer---The Contour Level Selection flag is critical to how contour levels are chosen. It not only determines how many contour levels are chosen, it also determines which contour level selection method is used. By default n=16.
0
Conpack does not pick contour levels at all; the current values of the parameters NCL, CLV, and associated arrays are not changed. They thus retain the values chosen by you, or by Conpack during a previous call. This option is used in module "Cp 4.10 Choosing your own contour levels."
-n
Where n is a positive integer, Conpack generates exactly n contour levels, splitting the range from the minimum field value to the maximum field value into n+1 equal intervals. This option is discussed further in the modifying Conpack-chosen levels modules Cp 4.7 and Cp 4.8.
+n
By default, Conpack chooses contour intervals at base*k, where the base value is some nice value either chosen by Conpack or set with the CIS parameter, and k is an integer. A nice value for base is defined by the contents of CIT, and chosen in such a way as to give at least n contour levels. Using the default CIT, you may get as many as 2n levels. In other words, n<=kmax-kmin+1<=2n. This option is discussed further in the default contour level selection modules Cp 4.4 through Cp 4.6.
If CIS>0 and CMN>CMX (your contour field minimum is set greater than your contour field maximum), then Conpack uses values of the form CIS*k, where k is used as above. If CIS>0 and CMN<=CMX (your contour minimum is set less than or equal to your contour maximum), then Conpack uses values of the form CMN+CIS*k, where k is an integer greater than or equal to CMN and less than or equal to CMX.

Discussion

Giving CLS a negative value is most commonly used with solid-fill color contour levels since the color table must have a pre-set number of colors in it.

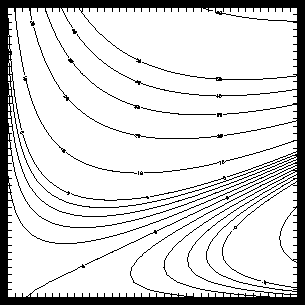
Line 1 of the ccpncls.f code segment sets the CLS parameter; the value 10 tells Conpack to use exactly ten contour lines at equally spaced intervals. Contours are then initialized and drawn normally.

Notice that in this case, contour line labels are not drawn. The only way to get contour labels drawn using this technique is to set the CLU parameter for the specific lines that you want labeled. This option is discussed in section "Cp 6. Contour line labels."
Exercises

  1. Using the ccpncls example, set CMN=10., and CMX=10.0.
  2. Don't set CLS, but set NCL (the number of contour levels) to 10, and explain what happens.

Cp 4.10 Choosing your own contour levels

In some cases, you may want to take the controls into your own hands and specify each contour level for one or more Conpack plots. Setting all of the contour levels involves first telling Conpack that you are choosing the levels and how many levels you want. Then you assign a value for each level.

Nineteen hand-picked contour levels

Code segment from ccphand.f

1       DATA RLEVEL /-20., -10., -5., -4., -3., -2., -1., 0., 1., 2., 3., 4.,
       + 5., 10., 20., 30., 40., 50., 100. /
2       CALL CPSETI ('CLS - CONTOUR LEVEL SELECTION FLAG', 0)
3       CALL CPSETI ('NCL - NUMBER OF CONTOUR LEVELS', INCL)
4       DO 10, I=1, INCL
5          CALL CPSETI ('PAI - PARAMETER ARRAY INDEX', I)
6          CALL CPSETR ('CLV - CONTOUR LEVEL VALUES', RLEVEL(I))
7          IF (AMOD (RLEVEL(I), 5.) .EQ. 0)
       +     CALL CPSETI ('CLU - CONTOUR LEVEL USE FLAGS', 3)
8   10  CONTINUE
9       CALL CPRECT (Z, K, M, N, RWRK, LRWK, IWRK, LIWK)
10      CALL CPBACK (Z, RWRK, IWRK)
11      CALL CPCLDR (Z, RWRK, IWRK)

Synopsis

      CALL CPSETI ('CLS', cls)
      CALL CPSETI ('NCL', ncl)
      CALL CPSETI ('PAI', i)
      CALL CPSETR ('CLV', clv)
Arguments

CLS
Integer---The Contour Level Selection flag is critical to how contour levels are chosen. It not only determines how many contour levels are chosen, it also determines which contour level selection method is used. By default n=16.
0
Conpack does not pick contour levels at all; the current values of the parameters NCL, CLV, and associated arrays are not changed. They thus retain the values chosen by you, or by Conpack during a previous call.
-n
Where n is a positive integer, Conpack generates exactly n contour levels, splitting the range from the minimum field value to the maximum field value into n+1 equal intervals. This option is discussed further in the modifying Conpack-chosen levels modules Cp 4.7 and Cp 4.8.
+n
By default, Conpack chooses contour intervals at base*k, where the base value is some nice value either chosen by Conpack or set with the CIS parameter, and k is an integer. A nice value for base is defined by the contents of CIT, and chosen in such a way as to give at least n contour levels. Using the default CIT, you may get as many as 2n levels. In other words, n<=kmax-kmin+1<=2n. This option is discussed further in the default contour level selection modules Cp 4.4 through Cp 4.6.
If CIS>0 and CMN>CMX (your contour field minimum is set greater than your contour field maximum), then Conpack uses values of the form CIS*k, where k is used as above. If CIS>0 and CMN<=CMX (your contour minimum is set less than or equal to your contour maximum), then Conpack uses values of the form CMN+CIS*k, where k is an integer greater than or equal to CMN and less than or equal to CMX.
NCL
Integer---The Number of Contour Levels value is used by many Conpack routines. The Conpack initialization routines set NCL to zero. If CLS<>0, NCL is then set to some number of contour levels when contour levels are picked by CPPKCL or the contour-drawing routines.
PAI
Integer---The Parameter Array Index must be set to specify the array element that is to be changed. For example, if you want to change the third contour level value to 3.33, you would set PAI=3, then set CLV to 3.33.
CLV(NCL)
Real array---Each of the first NCL elements of the parameter array CLV (Contour Level Values) specifies a numerical value given to a contour level.
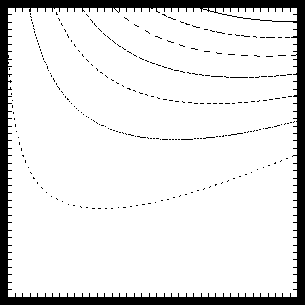
Lines 1 and 2 of the ccphand.f code segment create an array with data values that will become contour level values. Line 3 tells Conpack that we are choosing our own contour levels by setting CLS=0. Line 4 sets the number of contour levels to be the same as elements in our data array LEVEL. Lines 5 through 9 set each contour level value, first by specifying the contour level number with PAI, then by specifying a value with CLV. We also set CLU so that labels are drawn on levels divisible by 5. Conpack is then initialized, and contours are drawn normally. Notice that contour level values do not need to be assigned in any particular order.

Exercises

  1. Change ccphand.f so that it draws contour levels at 5, 25, 35, 65, and 60.
  2. Change ccphand.f so that it draws contour levels at (10, 0, 10, 20, . . . 100). You have learned two ways to do this.

Cp 4.11 Line attributes: Line dash patterns

Contour line patterns are controlled by the CLD parameter. CLD is a parameter array that allows you to choose different line patterns for each contour level.

Contour line patterns

Code segment from ccpcld.f

1       DATA IBTS / 0, 0, 0, 1, 0, 0, 0, 1, 0, 0, 0, 1, 0, 0, 0, 1,
2    1              1, 0, 1, 0, 1, 0, 1, 0, 1, 0, 1, 0, 1, 0, 1, 0,
3    2              1, 1, 0, 0, 1, 1, 0, 0, 1, 1, 0, 0, 1, 1, 0, 0,
4    3              1, 1, 1, 0, 1, 1, 1, 0, 1, 1, 1, 0, 1, 1, 1, 0,
5    4              1, 1, 1, 1, 0, 0, 0, 0, 1, 1, 1, 1, 0, 0, 0, 0,
6    5              1, 1, 1, 1, 0, 1, 1, 1, 0, 0, 1, 1, 0, 0, 0, 1,
7    6              1, 1, 1, 1, 1, 1, 1, 1, 1, 1, 1, 1, 1, 1, 1, 1 /
8
9       CALL CPSETI ('CLS - CONTOUR LEVEL SELECTION FLAG', -7)
10      CALL CPRECT (Z, K, M, N, RWRK, LRWK, IWRK, LIWK)
11      CALL CPPKCL (Z, RWRK, IWRK)
12      CALL CPGETI ('NCL - NUMBER OF CONTOUR LEVELS', NOCL)
13      DO 11, I=1, NOCL 
14         CALL CPSETI ('PAI - PARAMETER ARRAY INDEX', I)
15         CALL CPSETI ('CLD - CONTOUR LINE DASH PATTERN', IPAT (IBTS (1, I)))
16  11  CONTINUE
17      CALL CPBACK (Z, RWRK, IWRK)
18      CALL CPCLDR (Z, RWRK, IWRK)

Synopsis

      CALL CPSETI ('PAI', i)
      CALL CPSETI ('CLD', icld)
      CALL CPSETC ('CLD', 'string')

Arguments

CLD(NCL)
Integer array or Character expression array---Each element of the Contour Line Dash pattern parameter array specifies a dash pattern to be drawn at a specific contour level if DPU<>0. DPU is the Dash Pattern Use flag. By default, DPU=3.

Discussion

Setting values of CLD may not affect contour line patterns when contour lines are drawn with CPCLDM. CLS is primarily used when drawing contour lines with CPCLDR. There are two methods for setting CLD; you can set it either as an integer array or as a character expression array.

When CLD is an integer array, the dash pattern relies on a 16-bit binary number where each 1 produces a dash and each 0 produces a space. You need to choose a dash pattern in binary, like "1111000011110000", then convert it to decimal:

      CALL CPSETI ('CLD', 61680)
In this scenario, a solid line has the value 65535. Note that CLD is set with the CPSETI routine in this case.

When CLD is a character expression array, the dash pattern allows you to make patterns of nearly any Fortran character. Dollar signs ($) are used to specify dashes, and single quotation marks (') are used to specify blanks. So, to get the same dash pattern as in the DASHDB example:

      CALL CPSETC ('CLD', '$$$$''''''''$$$$''''''''')
Note that when you set CLD with a character string, you need to call CPSETC. Also, since CLD is an array, you must use PAI with CLD and set a dash pattern for each contour line to be drawn. Three elements of CLD, with negative array indices, allow you to modify some lines that are not contour lines:

------------------------------------------------------
PAI  CLD                                                
------------------------------------------------------
-1   Specifies a dash pattern for the edge of the grid  
-2   Specifies a dash pattern for the edge of any area  
      filled with special values (SPV)                  
-3   Specifies a dash pattern for the edge of any area  
      in which CPMPXY returns an out-of-range           
      value (ORV)                                       
------------------------------------------------------
Dash patterns are assigned to contour levels in the order of the CLD array, not contour level value. For example, if you assign:

----------------------------------
CLD[1] = short dashes  CLV[1] = 6.  
CLD[2] = long dashes   CLV[2] = 4.  
CLD[3] = solid         CLV[3] = 5.  
----------------------------------
your lowest contour line (4.0), has a long dash pattern, your middle contour line (5.0) is solid, and your highest contour line (6.0) has a short dash pattern.

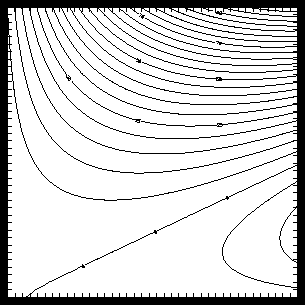
Lines 1 through 7 of the ccpcld.f code segment declare the binary bit patterns that we want to convert into decimal for use as dash patterns. Line 9 forces Conpack to use only seven contour lines since we'll only define seven dash patterns. Line 10 initializes Conpack, and line 11 picks the contour levels so that we can change their dash patterns. Line 12 retrieves the number of contour levels so that the code is more flexible, and lines 13 through 16 set a different dash pattern for each contour line.

Line 15, the heart of this process, first retrieves one of the dash patterns, then converts it to a decimal number using a function discussed later in this module. Then the contour line dash pattern is set using Conpack parameter CLD as an integer array. Line 17 draws a background, and line 18 draws contours.

In many cases, it can be cumbersome to convert from a 16-bit binary number to a decimal number. You can make this conversion with the UNIX command dc if you want to hard-wire your dash patterns. Or you can use this Fortran function to construct dash patterns inside your program:

      INTEGER FUNCTION IPAT (IBTS)
      INTEGER IBTS (16)
      IPAT = 0
      DO 101, I=1, 16
          IPAT=IOR(ISHIFT(IPAT,1),IBTS(I))
101   CONTINUE
      RETURN
      END
IBTS is an integer array in which you store each element of your 16-bit binary pattern. ISHIFT(M,N) is a function supplied with NCAR Graphics that shifts M left by N bits. IOR(K,L) is an NCAR Graphics-supplied function that does a logical "or" of K and L. The function IPAT is included in the ccpcld example.
Exercises

  1. Starting with ccpcld.f, use the default contour levels and make lines below zero have the pattern "$$$''''''''''", the zero line have the pattern "zero", and the lines above zero have the pattern "$$$$$$".
  2. Using either the dc command or IOR and ISHIFT, create a dash-dot-dash-dot pattern, and draw the perimeter with it. Hint: Use a single dash to represent the dot in the pattern.

Cp 4.12 Line attributes: Line thickness

Contour line thickness, or width, is controlled by the CLL parameter. CLL is a parameter array, allowing you to choose different line widths for each contour level.

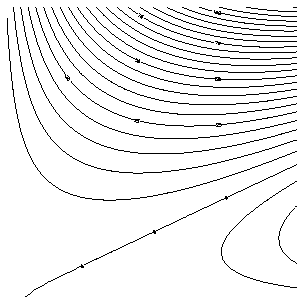
Contour line patterns

Code segment from ccpcll.f

1       CALL CPRECT (Z, K, M, N, RWRK, LRWK, IWRK, LIWK)
2       CALL CPPKCL (Z, RWRK, IWRK)
3       CALL CPGETI ('NCL - NUMBER OF CONTOUR LEVELS', NCON)
4       DO 11, I=1, NCON
5          CALL CPSETI ('PAI - PARAMETER ARRAY INDEX', I)
6          CALL CPSETR ('CLL - CONTOUR LINE LINE WIDTH', REAL (I) / 3.)
7   11  CONTINUE
8       CALL CPBACK (Z, RWRK, IWRK)
9       CALL CPCLDR (Z, RWRK, IWRK)

Synopsis

      CALL CPSETI ('PAI', i)
      CALL CPSETR ('CLL', cll)

Arguments

CLL(NCL)
Real array---Each element of the Contour Line Line width parameter specifies a line width to be drawn with the associated element of the contour level value array CLV. Each line width is expressed as a multiple of the normal line width; values less than or equal to zero imply that the line width should not be set. Alternatively, you can change all line widths simultaneously by calling GKS routine GSLWSC prior to the Conpack drawing routines.
There are three special elements in CLL, corresponding to negative index values:
--------------------------------------------
CLL(-1)  Specifies a line width for the edge  
          of the grid.                        
CLL(-2)  Specifies a line width for the edge  
          of any area filled with special     
          values.                             
CLL(-3)  Specifies a line width for the edge  
          of any area in which CPMPXY         
          returns an out-of-range value.      
--------------------------------------------
Line widths are assigned to contour levels in the order of the CLL array, not contour level value. For example, if you assign:
----------------------------
CLL[1] = thin    CLV[1] = 6.  
CLL[2] = thick   CLV[2] = 4.  
CLL[3] = medium  CLV[3] = 5.  
----------------------------
your lowest contour level (4.0), has a thick line, your middle contour line (5.0) has a medium line, and your highest contour line (6.0) has a thin line.

Discussion

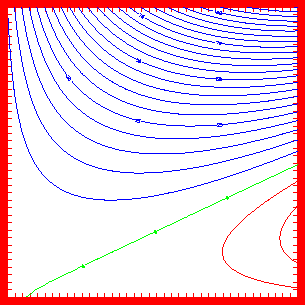
Line 1 of the ccpcll.f code segment initializes Conpack. Line 2 forces contour lines to be chosen so that we can modify them. Line 3 gets the number of contour levels, then lines 4 through 7 assign increasingly thick widths to each contour line by cycling through each contour level in a DO loop. This generates the thick lines in the upper right corner of the graphic. Lines 8 and 9 draw contours normally.

Exercises

  1. Using the ccpcll example, set all lines to the default width, but make the zero line twice as thick as the rest.
  2. Using the ccpcll example, make the perimeter three times thicker than normal.
  3. Using the GKS routine GSLWSC, set all contour line widths to three times their normal thickness.

Cp 4.13 Line attributes: Line color

Contour line color is controlled by the CLC parameter and the GKS color-setting routine GSCR. CLC is a parameter array, allowing you to choose different line colors for each contour level.

Contour line color

Code segment from ccpclc.f

1       CALL COLOR
2       CALL CPRECT (Z, K, M, N, RWRK, LRWK, IWRK, LIWK)
3       CALL CPPKCL (Z, RWRK, IWRK)
4       CALL CPGETI ('NCL - NUMBER OF CONTOUR LEVELS', NCON)
5       DO 11, I=1, NCON
6          CALL CPSETI ('PAI - PARAMETER ARRAY INDEX', I)
7          CALL CPGETR ('CLV - CONTOUR LEVEL VALUES', CVAL)
8          IF (CVAL .LT. 0.0) THEN
9             CALL CPSETI ('CLC - CONTOUR LINE COLOR INDEX', 1)
10         ELSE IF (CVAL .EQ. 0.0) THEN
11            CALL CPSETI ('CLC - CONTOUR LINE COLOR INDEX', 2)
12         ELSE
13            CALL CPSETI ('CLC - CONTOUR LINE COLOR INDEX', 3)
14         ENDIF
15  11  CONTINUE
16
17      SUBROUTINE COLOR
18      CALL GSCR (1, 0, 0., 0., 0.)
19      CALL GSCR (1, 1, 1., 0., 0.)
20      CALL GSCR (1, 2, 0., 1., 0.)
21      CALL GSCR (1, 3, 0., 0., 1.)

Synopsis

      CALL CPSETI ('PAI', i)
      CALL CPSETI ('CLC', iclc)

Arguments

CLC(NCL)
Integer array---Each element of the Contour Line Color parameter specifies a color index to be used when drawing a contour line at the level specified by the associated element of the contour level value array CLV. Each color index represents an RGB triplet set with the GSCR subroutine.
There are three special elements in CLC that correspond to negative index values:
---------------------------------------
CLC(-1)  Specifies a line color for the  
          edge of the grid.              
CLC(-2)  Specifies a line color for the  
          edge of any area filled with   
          special values.                
CLC(-3)  Specifies a line color for the  
          edge of any area in which      
          CPMPXY returns an out-of       
         -range value.                   
---------------------------------------
Note: Negative values of CLC elements imply no change in color.

Discussion

Lines 1 and 18 through 21 of the ccpclc.f code segment set up a color table so that lines can be drawn with different colors. An explanation of color tables appears in Chapter 7 "Color tables and color mapping systems" of NCAR Graphics Fundamentals.

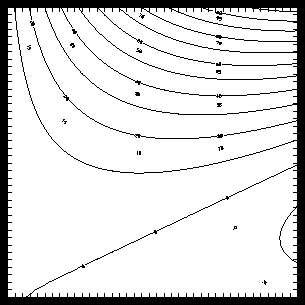
Line 2 initializes Conpack, and line 3 forces contour lines to be chosen so they can be modified. Line 4 gets the number of contour levels, so that we can choose a color for each contour line using the DO loop beginning in line 5. Since in this case we want to be sure that line color is correlated to contour level value, we get the contour level value in line 7, and use it in the if block to assign red to lines with negative values, green to the zero line, and blue to lines above zero. After setting contour line colors, we draw contours normally.
Exercises

  1. Using the ccpclc example, make the perimeter line white. (There are two ways to do this.)
  2. Using the ccpclc example, make each contour level a different color.

Cp 4.14 Line attributes: Turning contour line drawing off and on

Just as you can control specific values of individual contour lines, you can control exactly which lines are drawn. The parameter controlling this function, CLU, does two duties. First it determines whether or not a line will be drawn, then it determines if the line will be labeled. Control over the label-drawing aspect of the CLU parameter is discussed in module "Cp 6.5 Selecting lines for labels: Labeling specific lines."

Drawing individual contour lines

Code segment from ccpclu.f

1       CALL CPSETI ('CLS - CONTOUR LEVEL SELECTION FLAG', 0)
2       CALL CPSETI ('NCL - NUMBER OF CONTOUR LEVELS', 40)
3       DO 11, I=1, 40
4          CALL CPSETI ('PAI - PARAMETER ARRAY INDEX', I)
5          CALL CPSETR ('CLV - CONTOUR LEVEL VALUES', 5.0 * REAL(I) - 15.)
6          CALL CPSETI ('CLU - CONTOUR LEVEL USE FLAGS', MOD (I, 4))
7   11  CONTINUE
8       CALL CPRECT (Z, K, M, N, RWRK, LRWK, IWRK, LIWK)
9       CALL CPBACK (Z, RWRK, IWRK)
10      CALL CPCLDR (Z, RWRK, IWRK)

Synopsis

      CALL CPSETI ('CLU', iclu)

Arguments

CLU(NCL)
Integer array---Each element of the Contour Level Use flags parameter array indicates how the contour level indicated by the associated element of the CLV array is drawn.
0
No contour line or labels are drawn at this level.
1
A contour line is drawn without labels.
2
Contour labels are drawn, but no line is drawn.
3
Both a contour line and labels are drawn.
There are three special elements in CLU corresponding to negative index values:
---------------------------------------------
CLU(-1)  Specifies a flag for the edge of the  
          grid.                                
CLU(-2)  Specifies a flag for the edge of any  
          area filled with special values.     
CLU(-3)  Specifies a flag for the edge of any  
          area in which CPMPXY returns an      
          out-of-range value.                  
---------------------------------------------
In each case, if the flag is zero, the associated edge is not drawn, otherwise an edge is drawn. No labels are drawn for these special elements of CLU.

Discussion

Study the ccpclu example to see that the following values are assigned to these parameters:

-----------------------
PAI  CLV(PAI)  CLU(PAI)  
-----------------------
1    -10.0     1         
2    -5.0      2         
3    0.0       3         
4    5.0       0         
5    10.0      1         
6    15.0      2         
-----------------------
Also notice that contour level 10.0 is a solid line, contour level -5.0 is labeled but not drawn, contour level 0.0 is drawn and labeled, and contour level 5.0 is neither drawn nor labeled, in accordance with the CLU parameter.

Hence, line 1 of the ccpclu.f code segment tells Conpack that we will choose the contour levels. Line 2 sets the number of contour levels to 40, and lines 3 through 7 assign contour level values and set the CLU parameter to cycle through each of its four options. Lines 8 through 10 draw contours normally.

Exercises

  1. Modify ccprect.f so that every contour level is drawn but not labeled.
  2. Study the ccpspv example, and modify the code so it does not draw a boundary for the special value area.

Cp 5. Filling contour levels

What you have learned about filling areas with the Ezmap utility helps you understand how to fill contour levels with the Conpack utility.

Before you fill areas using Ezmap, you need to initialize Areas with the Areas initialization routine. You then initialize Ezmap with some special Ezmap initialization routines. Finally, you can fill regions you defined with Ezmap by calling the Areas routine ARSCAM. You fill contour levels with Conpack and Areas in exactly the same way.

Conpack functional outline

----------------------------------------------------------
    1.  Open GKS                                             
    2.  Set window and viewport                              
    3.  Put in titles and other labels                       
 *  4.  Set up general parameters                            
 *  5.  Set up area maps                                     
 *  6.  Initialize Conpack                                   
 *  7.  Force Conpack to choose contour levels if necessary  
 *  8.  Modify Conpack-chosen parameters                     
 *  9.  Draw labels                                          
    10.  Draw background                                     
 *  11.  Draw contour lines                                  
    12.  Call FRAME                                          
    13.  Close GKS                                           
----------------------------------------------------------
* Steps discussed in this section.
Cp 5.1 Area identifiers in Conpack

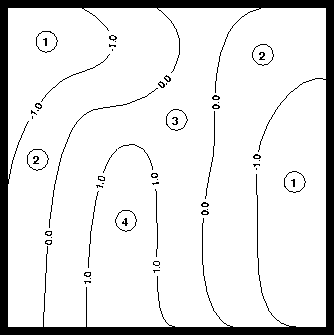
Recall from the Areas chapter that area identifiers are defined as numbers specifying an area to the right or to the left of an edge. Conpack uses the concept of above a contour line or below a contour line to assign area identifiers. Contours are always drawn so values less than the contour level ("below" it) are to the left, and values greater than or equal to the contour level ("above" it) are to the right. So areas "below" the contour in Conpack are equivalent to areas to the "left" of an edge in the Areas utility; areas "above" the contour are equivalent to areas to the "right" of an edge.

Linking an area identifier to a contour level

Synopsis

      CALL CPSETI ('AIA', iaia)
      CALL CPSETI ('AIB', iaib)

Arguments

AIA(NCL)
Integer array---Each element in the Area Identifier Above parameter array is an area identifier for the level above the contour line defined by the corresponding element in the CLV array.
AIA has three special elements that correspond to negative values of PAI:
-----------------------------------------------
PAI  AIA                                         
-----------------------------------------------
-1   Specifies the area identifier for the area  
      outside the edge of the grid               
-2   Specifies an area identifier for any        
      region filled with special values          
-3   Specifies an area identifier for any area   
      in which CPMPXY returns the out-of         
     -range-value ORV                            
-----------------------------------------------
AIB(NCL)
Integer array---Each element in the Area Identifier Below parameter array is an area identifier for the level below the contour line defined by the corresponding element in the CLV array.

Discussion

Notice in the illustration that all the areas above contour level -1.0 have area identifiers of 2, even though they are not connected. This is desirable so that you can do things like fill all contour levels of a given value with the same color or pattern. Also, because area identifiers are assigned using the concept of above and below (this is unique to contour plots), you don't need to know the direction in which contour lines are drawn.

If AIA=AIB=0 for a particular contour level, then that level is ignored by the CPCLAM subroutine when it adds contour levels to the area map. Otherwise, that contour level is added to the area map, and AIA and AIB are used as the area identifiers for each side of the contour line.

When you let Conpack choose contour levels, then AIA(I)=I+1, and AIB(I)=I, where I is the Ith contour level. We use this automatic numbering of contour levels in the next module.

Note: If you set the elements of AIA and AIB manually, you should make sure that they are consistent. In other words, if the contour levels with nonzero values of AIA and AIB are c1, c2, ... cn, where c1 < c2 < ... < cn, and ak is the area identifier above ck, and bk is the area identifier below ck, then for all 1<=k<=n-1, ak = bk+1. Otherwise you will confuse the Areas utility, and strange results will occur.

Cp 5.2 Group identifiers in Conpack

An earlier part of this Conpack chapter stated that contour lines are added to group 3 and Conpack vertical strips are added to group 4. However, if this is inconvenient for your purposes, you can change it. Three parameters control the group in which Conpack puts things: GIC for contour lines, GIL for label boxes, and GIS for vertical strips.

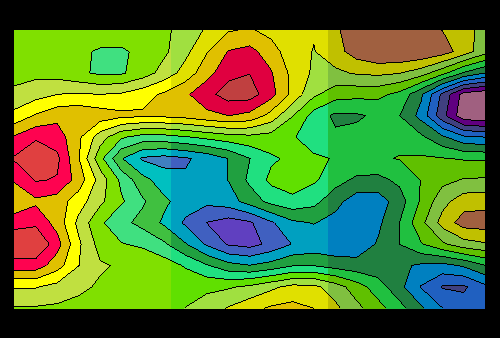
Some hardware devices will fail when attempting to fill an area that is defined by too many points. To reduce the number of points in any given area, you can define vertical strips, and then fill the areas within these strips. As you specify more strips, you reduce the number of points that define any given area in a contour level.
Vertical strips in Conpack

Code segment from ccpvs.f

1       CALL CPSETI ('NVS - NUMBER OF VERTICAL STRIPS', 3)
2       CALL CPRECT (ZDAT, 23, 23, 14, RWRK, LWRK, IWRK, LWRK)
3
4       SUBROUTINE FILL (XCRA, YCRA, NCRA, IAREA, IGRP, NGRPS)
5          IFILL = 0
6          DO 101, I=1, NGRPS
7                 IF (IGRP(I) .EQ. 3) IFILL = IAREA(I)
8  101     CONTINUE

Synopsis

      CALL CPSETI ('GIC', igic)
      CALL CPSETI ('GIL', igil)
      CALL CPSETI ('GIS', igis)
      CALL CPSETI ('NVS', nvs)

Arguments

GIC
Integer---The Group Identifier for Contour lines parameter allows you to specify the group in an area map to which you want contour lines added. GIC=3 by default.
GIL
Integer---The Group Identifier for Label boxes parameter allows you to specify the group in an area map to which you want label boxes added. GIL=3 by default.
GIS
Integer---The Group Identifier for vertical Strips parameter specifies the group identifier for a group of edges added to an area map by the subroutine CPCLAM in order to create a set of vertical strips. GIS is only used if NVS<>0. By default, GIS=4.
NVS
Integer---The Number of Vertical Strips parameter specifies how many vertical strips are to be used. When NVS is nonzero, an extra group of edges, with group identifier GIS, is added to the area map by CPCLAM. These edges include the boundary of the viewport and vertical lines that break the viewport area into NVS vertical strips. The area identifier for the outside of the viewport is -1, and all other area identifiers are 0. By default, NVS=1.

Discussion

Vertical strips are not needed by most modern hardware. However, it is important to understand the concept, since by default a single vertical strip is created by every call to CPCLAM. This is why our filling and shading routines check each group and area identifier, and sift out only the area identifiers specific to the group that we want to shade or color. Lines 5 through 8 of the ccpvs.f code segment select only area identifiers belonging to the contour level group.

Notice that line 1 of the ccpvs.f code segment sets the number of vertical strips to 3. Then line 2 initializes Conpack normally. Vertical strips are usually invisible when finished, but in this example, they are given different color shades to emphasize them for you to study.

GIC, GIL, and GIS must be set before any call to CPCLAM or CPLBAM so they will be effective; this is discussed in the next module. Occasionally you may want to set GIC and GIL because you have another edge group that is already assigned to group 3. However, unless you need to change GIC, GIL, or GIS, it is recommended that you do not change their values.
Cp 5.3 Initialize Conpack with Areas

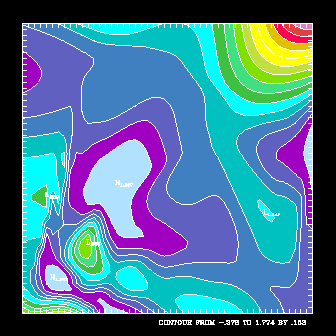
As in Ezmap, you need three calls to initialize Conpack with Areas. You need to initialize Areas by calling ARINAM, initialize Conpack by calling CPRECT, CPSPS1, or CPSPS2, and add contours to the area map using CPCLAM.

Conpack with Areas

Code segment from ccpfil.f

1       EXTERNAL FILL
2       CALL COLOR
3       CALL ARINAM (MAP, LMAP)
4       CALL CPSETI ('CLS - CONTOUR LEVEL SELECTION FLAG', NCL)
5       CALL CPRECT (ZREG, MREG, MREG, NREG, RWRK, LRWK, IWRK, LIWK)
6       CALL CPCLAM (ZREG, RWRK, IWRK, MAP)
7       CALL GSFAIS (1)
8       CALL ARSCAM (MAP, XWRK, YWRK, NWRK, IAREA, IGRP, NOGRPS, FILL)
9       CALL CPBACK (ZREG, RWRK, IWRK)
10      CALL CPLBDR (ZREG, RWRK, IWRK)
11      CALL CPCLDR (ZREG, RWRK, IWRK)

Synopsis

      CALL ARINAM (MAP, LMAP)
      CALL CPRECT (ZREG, K, M, N, RWRK, LRWK, IWRK, LIWK)
      CALL CPSPS1 (ZSPS, KSPS, MSPS, NSPS,RWRK, LRWK, IWRK, LIWK,ZREG, 
     +             LZRG)
      CALL CPSPS2 (XSPS, YSPS, ZSPS, KSPS,MSPS, NSPS, RWRK, LRWK, IWRK,
     +             LIWK, ZREG, LZRG)
      CALL CPCLAM (ZREG, RWRK, IWRK, MAP)

Arguments

The first three arguments to CPCLAM are arrays used in the last call to CPRECT, CPSPS1, or CPSPS2, the contents of which must not have been changed since that call.

ZREG(K,M) or ZREG(LZRG)
Real array, Input---The array containing regularly spaced data to be contoured.
RWRK(LRWK)
Real array, Workspace---The real workspace array.
IWRK(LIWK)
Integer array, Workspace---The integer workspace array.
MAP(LMAP)
Integer array, Workspace---The array containing the area map to which contour lines are to be added. Dimensioned as specified in the last call to the Areas routine ARINAM.

Discussion

The routine CPCLAM, which adds contour lines generated from the data in the ZREG array to the area map in the MAP array, may be called at any time after the initialization call to CPRECT, CPSPS1, or CPSPS2. The area map must previously have been initialized by a call to the routine ARINAM, in the Areas utility.

The contour lines added to the area map are as specified by the first NCL (Number of Contour Lines) elements of the parameter arrays CLV, AIA, and AIB. If NCL is zero, CPPKCL is called to generate these values.

If, for a given value of I between 1 and NCL inclusive, the Ith element of either AIA or AIB is nonzero, then the contour lines specified by the Ith element of CLV are added to the area map, with the Ith element of AIA as the area identifier for the area "above" each line (where field values are greater than they are along the line), and with the Ith element of AIB as the area identifier for the area "below" each line (where field values are less than they are along the line).

If a given contour level occurs twice in the array CLV, then the desired value of AIA may be associated with one contour level, and the desired value of AIB may be associated with the other contour level that has the same value.

If the parameter T2D (Tension on 2-Dimensional splines) has a nonzero value, the contour lines are smoothed, using cubic splines under tension.

Four other types of lines are added to the area map by CPCLAM:

The area identifier for the outside of the viewport is always -1. You can specify area identifiers for these areas using negative values for PAI and setting values in AIA. Please see the previous module for details.

Lines are added to the area map in the following order:

  1. The edge of the viewport and the vertical lines within it
  2. The edges of the out-of-range areas, if any
  3. The edge of the grid
  4. The edges of the special-value areas, if any
  5. The contour lines, in order of increasing contour level
The edge of the viewport may be added to the area map twice:

The object of number 1 in the preceding sequence is to prevent problems that arise when mapping is turned on and the mapping function has a line of discontinuity (for example, when using Ezmap with a cylindrical equidistant projection). Vertical lines are added by the subroutine CPCLAM to break up the areas represented by the area map into smaller pieces. Whether this is done or not is under your control, by means of the NVS and GIS parameters. For more information, see module "Cp 5.2 Group identifiers in Conpack."

If, during the last call to CPRECT, CPSPS1, or CPSPS2, the data being contoured were found to be essentially constant, then no contour lines are added to the area map; however, the other lines are added.

Line 1 of the ccpfil.f code segment declares the fill routine to be external so we can pass it into ARSCAM. Line 3 initializes Areas. Line 4 sets the number of contour levels to a fixed value, in this case 15, or the number of colors defined in the color table.

Line 5 initializes Conpack, and line 6 adds the contour lines to the area map. Line 7 sets the interior fill style to be solid so that we don't get hollow fill, and line 8 fills the contour levels using the Areas routine ARSCAM. Lines 9 through 11 draw a perimeter, labels, and contour lines.
Cp 5.4 Adding label boxes to the area map

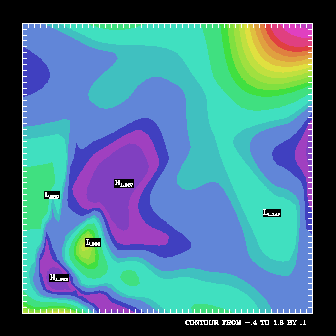
Examine the graphic in the previous module to see that the contour line labels have disappeared, and that the high and low labels are not readily distinguishable from the levels that contain them. In cases like this, you may want to place these labels in boxes to make them more visible. Since you use a masking procedure to draw these boxes and protect their interiors from contour lines and the fill options being used, the boxes must also be added to the area map.

Adding label boxes to an area map

Code segment from ccplbam.f

1       EXTERNAL FILL
2       CALL COLOR
3       CALL ARINAM (MAP, LMAP)
4       CALL CPRECT (ZREG, MREG, MREG, NREG, RWRK, LRWK, IWRK, LIWK)
5       CALL CPCLAM (ZREG, RWRK, IWRK, MAP)
6       CALL CPLBAM (ZREG, RWRK, IWRK, MAP)
7       CALL GSFAIS (1)
8       CALL ARSCAM (MAP, XWRK, YWRK, NWRK, IAREA, IGRP, NOGRPS, FILL)
9       CALL CPBACK (ZREG, RWRK, IWRK)
10      CALL CPLBDR (ZREG, RWRK, IWRK)

Synopsis

      CALL CPLBAM (ZREG, RWRK, IWRK, MAP)

Arguments

The first three arguments to CPLBAM are arrays used in the last call to CPRECT, CPSPS1, or CPSPS2, the contents of which must not have been changed since that call.

ZREG
Real array, Input---The densely gridded data array.
RWRK
Real array, Workspace---The real workspace array.
IWRK
Integer array, Workspace---The integer workspace array.
MAP
Integer array, Workspace---The array holding the area map to which the label boxes will be added. MAP must be initialized with a call to ARINAM, which is part of the Areas utility, before calling CPLBAM.

Discussion

The CPLBAM routine, which adds label boxes to an area map, may be called at any time after the initialization call to CPRECT, CPSPS1, or CPSPS2, and after the initialization call to ARINAM. If, during the last call to CPRECT, CPSPS1, or CPSPS2, the data being contoured were found to be essentially constant, then the box for the constant field label is added to the area map. Otherwise, boxes for the information label, the high and low labels, and/or the contour line labels are added, as follows:

Remember that the box is added to the area map; it is not drawn. Moreover, if you draw contour lines without masking them against the area map, they may cross through label boxes.

Line 1 of the ccplbam.f code segment declares the fill routine to be external so that it can be passed to ARSCAM. Line 2 sets up our color table. Lines 3 through 6 initialize Areas, initialize Conpack, add contour lines to the area map, then add label boxes to the area map. Lines 7 and 8 color-fill the contour levels. Lines 9 and 10 draw a perimeter and labels.
Cp 5.5 Masking areas: Label boxes

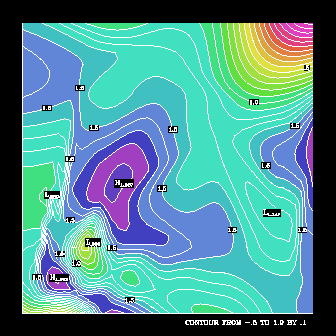
CPCLDM allows you to draw contour lines masked by your area map. One of its arguments is a routine that decides whether to draw portions of the contour line based on area identifier information provided for them. This routine is discussed in detail in the next module.

Protecting label boxes from contour lines

Code segment from ccpcldm.f

1       EXTERNAL FILL
2       EXTERNAL CPDRPL
3
4       CALL CPSETI ('LLP - LINE LABEL POSITIONING', 2)
5       CALL CPRECT (ZREG, MREG, MREG, NREG, RWRK, LRWK, IWRK, LIWK)
6       CALL ARINAM (MAP, LMAP)
7       CALL CPLBAM (ZREG, RWRK, IWRK, MAP)
8       CALL CPLBDR (ZREG, RWRK, IWRK)
9       CALL CPCLAM (ZREG, RWRK, IWRK, MAP)
10      CALL ARSCAM (MAP, XWRK, YWRK, NWRK, IAREA, IGRP, NOGRPS, FILL)
11      CALL CPCLDM (ZREG, RWRK, IWRK, MAP, CPDRPL)

Synopsis

      CALL CPCLDM (ZREG, RWRK, IWRK, MAP, MASK)

Arguments

The first three arguments to CPCLDM are arrays used in the last call to CPRECT, CPSPS1, or CPSPS2, the contents of which must not have been changed since that call. The area map, MAP, must also be initialized with a call to ARINAM before calling CPCLDM. The dimensions of the following arrays are passed into CPCLDM in COMMON blocks.

ZREG
Real array, Input---The densely gridded data array.
RWRK
Real array, Workspace---The real workspace array.
IWRK
Integer array, Workspace---The integer workspace array.
MAP
Integer array, Workspace---The array containing the area map to be used for masking the contour lines as they are drawn.
MASK
Subroutine---An external subroutine to process the polylines that result from masking the generated contour lines and other edges against the area map. MASK must be declared external in the routine that calls CPCLDM. You can either write your own MASK routine, or you can use the Conpack routine CPDRPL to protect label boxes. Module "Cp 5.6 Masking areas: Box masking routines" discusses the CPDRPL routine.

Discussion

The routine CPCLDM may be called at any time after the initialization call to CPRECT, CPSPS1, or CPSPS2, and after the initialization call to ARINAM. CPCLDM does not draw the lines; it generates them, masks them against a user-specified area map, and generates calls, one for each polyline resulting from the masking process, to the user-specified routine, MASK.

Each such polyline lies in precisely one of the areas defined by the area map. The MASK routine may use the information provided by its arguments (that describe the area the polyline is in) to decide whether or not to draw the polyline.

The contour lines generated are those specified by the first NCL elements of the parameter arrays CLV and CLU. If NCL is zero, CPPKCL is called to generate these values. Each element of CLV specifies a contour level and the corresponding element of CLU specifies whether or not contour lines are to be generated at that level. If the parameter T2D has a nonzero value, the contour lines are smoothed, using cubic splines under tension.

If the element of the parameter array CLU corresponding to PAI=-1 is nonzero, the edge of the grid is also generated. If the element of CLU corresponding to PAI=-2 is nonzero, the edges of special-value areas (if any) are generated. If the element of CLU corresponding to PAI=-3 is nonzero, the edges of out-of-range areas (if any) are generated. By default, none of these edges are generated.

Groups of lines are generated in the following order:

  1. Contour lines for each of the specified levels, in ascending numeric order
  2. The edges of special-value areas, if any
  3. The edges of out-of-range areas, if any
  4. The edge of the grid
The color, dash pattern, and line width to be used for the lines drawn may be specified by elements of the parameter arrays CLC, CLD, and CLL, respectively. Each of these contains elements corresponding to values of PAI from 1 to NCL and three special elements, corresponding to PAI=1, 2, and 3.

Before and after each group of lines is generated, the routine CPCHCL is called; a user-supplied version of this routine may override the settings for color, dash pattern, and line width. Also, of course, the routine MASK, which actually does the drawing, may override the settings of these quantities.

Conpack's Dash Pattern Use parameter DPU affects the pattern used to draw the lines. When DPU<=0, lines are drawn by calling the SPPS routine CURVE. The lines are all solid and unlabeled and specified dash patterns are not used. When DPU>0, lines are drawn by calling the Dashline routine CURVED. Lines are solid or dashed, depending on the dash pattern specified by the appropriate element of CLD.

If LLP=1 or LLP=1, then the dash pattern for the lines to be labeled is constructed by replicating, DPU times, the dash pattern specified by the appropriate element of CLD, and then appending to it the characters specified by the appropriate element of LLT. If LLP=1 or LLP=1, then label boxes are not created for contour line labels.

If, during the last call to CPRECT, CPSPS1, or CPSPS2, the data being contoured were found to be essentially constant, then no contour lines are generated. Instead, the constant-field label is written. Other lines are still generated.

Lines 1 and 2 of the ccpcldm.f code segment declare the fill and masking routines to be external so that they can be passed into ARSCAM and CPCLDM respectively. Line 4 chooses the regular labeling scheme so that label boxes can be drawn. Lines 5 and 6 initialize Conpack and Areas respectively.

Lines 7 and 8 add labels to the area map, then draw them. Similarly, line 9 adds contour lines to the area map, and line 11 draws them. By filling the contour levels before drawing the contour lines, we ensure that the contour lines are visible in the final plot.
Exercises

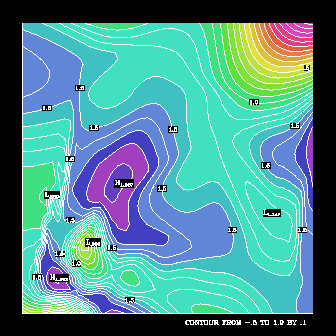
  1. Using the ccpcldm example, call CPCLDR instead of CPCLDM, and see what happens.

Cp 5.6 Masking areas: Box masking routines

CPCLDM requires a masking routine to decide when contour lines will be masked, and which lines should be drawn. Conpack offers the default masking routine CPDRPL to mask label boxes. If you need a smarter routine, for example one that masks contour levels only over the ocean, please see module "Cp 8.2 Masking areas: Label boxes and land masses." If you use CPDRPL, be sure to declare it external in the routine that calls CPCLDM.

Protecting label boxes from contour lines

Code segment from ccpdrpl.f

1       IDR=1
2       DO 101, I=1, NAI
3          IF (IAI(I) .LT. 0) IDR=0
4  10   CONTINUE
5       IF (IDR .NE. 0) THEN
6          IF (IDUF .EQ. 0) THEN
7             CALL CURVE (XCS, YCS, NCS)
8          ELSE
9             CALL CURVED (XCS, YCS, NCS)
10         ENDIF
11      ENDIF
12      RETURN
13      END

Synopsis

      CALL CPDRPL (XCS, YCS, NCS, IAREA, IGRP, NGRP)

Arguments

XCS(NCS)
Real array, Input---An array containing the X coordinates of NCS points defining a polyline.
YCS(NCS)
Real array, Input---An array containing the Y coordinates of NCS points defining a polyline.
NCS
Integer, Input---The number of points defining the polyline.
IAREA(NGRP)
Integer array, Input---An array of area identifiers for the area in which the polyline lies. For each I from 1 to NGRP, IAREA(I) is the area identifier of the area with respect to the edge group IGRP(I).
IGRP(NGRP)
Integer array, Input---An array of group identifiers. See the description of IAREA, above.
NGRP
Integer---The number of group identifiers in the array IGRP.

Discussion

CPDRPL is an internal Conpack routine, it must be declared external when used with CPCLDM. Documentation is provided here in case you need to modify it. CPDRPL uses a call to CURVE or a call to CURVED, depending on the current value of the DPU parameter.

If the only reason you are using CPCLDM instead of CPCLDR is to avoid drawing contour lines through labels, follow these steps:

  1. In the subroutine that calls CPCLDM, insert the declaration EXTERNAL CPDRPL.
  2. In the call to CPCLDM, use CPDRPL for the final argument.
Each time CPDRPL is called, it draws the polyline defined by its first three arguments if, and only if, none of the area identifiers defined by the other three arguments is negative.

The code in the ccpdrpl example is taken from the default version of CPDRPL. Note that lines 1 through 4 of the ccpdrpl.f code segment first check for a negative area identifier, then turn off line drawing if it is negative. If the area identifier is positive (it's not in a label box or outside the perimeter), then line 6 checks to see if Conpack is drawing using Dashline, then draws the contour line in a way consistent with how the parameters are set.
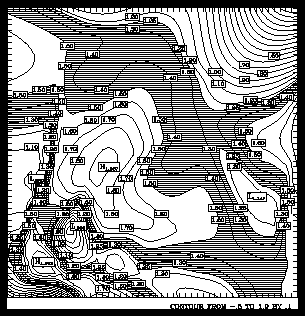
Cp 5.7 Filling contour levels

Filling contour levels is just like filling geographic areas in Ezmap, only easier, because in this case you know exactly what your area identifiers are. In this case, it is only necessary to call ARSCAM with an appropriate fill routine.

Filling selected contour levels

Code segment from ccpscam.f

1       EXTERNAL SFILL
2       EXTERNAL CPDRPL
3
4       CALL CPRECT (ZREG, MREG, MREG, NREG, RWRK, LRWK, IWRK, LIWK)
5       CALL CPPKCL (ZREG, RWRK, IWRK)
6       CALL CPGETI ('NCL - NUMBER OF CONTOUR LEVELS', NCL)
7       DO 111, I=1, NCL
8          CALL CPSETI ('PAI - PARAMETER ARRAY INDEX', I)
9          CALL CPSETI ('CLU - CONTOUR LEVEL USE FLAGS', 3)
10         CALL CPSETI ('AIA - AREA IDENTIFIER ABOVE', 0)
11         CALL CPSETI ('AIB - AREA IDENTIFIER BELOW', 0)
12 111  CONTINUE
13      CALL CPSETI ('NCL - NUMBER OF CONTOUR LEVELS', NCL + 2)
14      CALL CPSETI ('PAI - PARAMETER ARRAY INDEX', NCL + 1)
15      CALL CPSETR ('CLV - CONTOUR LEVEL VALUES', 1.25)
16      CALL CPSETI ('CLU - CONTOUR LEVEL USE FLAGS', 3)
17      CALL CPSETI ('AIA - AREA IDENTIFIER ABOVE', 1)
18      CALL CPSETI ('AIB - AREA IDENTIFIER BELOW', 2)
19      CALL CPSETI ('PAI - PARAMETER ARRAY INDEX', NCL + 2)
20      CALL CPSETR ('CLV - CONTOUR LEVEL VALUES', 1.5)
21      CALL CPSETI ('CLU - CONTOUR LEVEL USE FLAGS', 3)
22      CALL CPSETI ('AIA - AREA IDENTIFIER ABOVE', 3)
23      CALL CPSETI ('AIB - AREA IDENTIFIER BELOW', 1)
24      CALL CPCLAM (ZREG, RWRK, IWRK, MAP)
25      CALL ARSCAM (MAP, XWRK, YWRK, NWRK, IAREA, IGRP, NOGRPS, SFILL)
26      CALL CPCLDM (ZREG, RWRK, IWRK, MAP, CPDRPL)

Synopsis

      CALL ARSCAM (MAP, XCS, YCS, MCS, IAREA, IGRP, ISIZ, FILL)

Arguments

MAP
Integer array, Workspace---The area map that has been initialized by a call to ARINAM and to which edges have been added by calls to AREDAM.
XCS(MCS), YCS(MCS)
Real arrays, Workspace---The X and Y coordinates defining the edge of a given area, for use by ARSCAM in calls to the area-processing routine FILL.
MCS
Integer, Input---The dimension of each of the arrays XCS and YCS.
IAREA(ISIZ), IGRP(ISIZ)
Integer arrays, Input---Arrays that are dimensioned ISIZ for use by ARSCAM in calls to the area-processing routine FILL.
ISIZ
Integer, Input---The dimension of each of the arrays IAREA and IGRP. ISIZ<=n, where n is the number of groups in the area map.
FILL
Subroutine---The user-supplied area-processing routine that is called by ARSCAM. FILL must be declared external in the routine that calls ARSCAM. FILL is described in full detail in the next module.

Discussion

ARSCAM is an Areas routine and is documented more completely in the Areas chapter: "Ar 3.4 Filling areas" and "Ar 3.5 Writing an area-fill routine." Because you should be comfortable with ARSCAM by now, the primary purpose of the ccpscam example is to illustrate how you might set up some area identifiers for contour levels in the case where you want to fill only a specific set of levels.

Lines 1 and 2 of the ccpscam.f code segment are required so that Fortran knows that the fill and contour line drawing routines are subroutines. Line 4 initializes Conpack, and line 5 forces contour lines to be chosen so that we can modify contour line information. Line 6 retrieves the number of contour levels, and lines 7 through 12 turn on contour line drawing and contour line labels for every line. They also turn off area identifier information for all contour lines. It is necessary to turn off area identifier information in this case because when we add the contour lines to shade between, we need to override Conpack's default area identifiers.

Line 13 tells Conpack that we're adding two new contour lines. Line 15 sets the value for the first new contour line at 1.25, and line 20 sets the value for the second at 1.5. Notice that Conpack has already chosen a contour line at 1.5. Conpack doesn't mind that it now has two contour lines with the same value. Because we set the area identifiers to zero for the contour at 1.5 that Conpack chose, Areas overrides those values with the new area identifiers that we set in lines 22 and 23. Notice that the area identifier for the area above the contour at 1.25 is set to 1 in line 17, and that the area identifier for the area below the contour at 1.5 is also set to 1 in line 23. It is critical that these two values match for correct area fill.
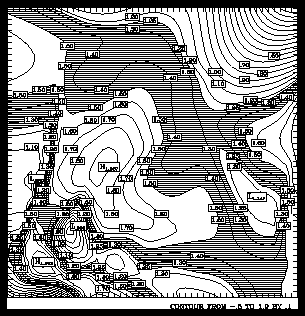
Exercises

  1. Modify subroutine CCPSCM in the ccpscam example so that it accepts a minimum and maximum contour level value for filling, and so that it fills from that minimum to that maximum level.
  2. Using the ccpscam example, modify subroutine CCPSCM so that every contour level has a different area identifier.

Cp 5.8 Filling contour levels: Writing a fill routine

It is easy to write a fill routine to handle contour levels. Since you assigned the area identifiers, and you know that contour levels are placed in group 3 unless you change the GIC parameter, all you do is set up a relationship between the area identifiers that you want to fill and choose a filling option.

Filling selected contour levels

Code segment from ccpscam.f

1       SUBROUTINE SFILL (XWRK, YWRK, NWRK, IAREA, IGRP, NGRPS)
2
3       REAL XWRK(*), YWRK(*), ISCR(5000)
4       INTEGER IAREA(*), IGRP(*), RSCR(5000)
5
6       DO 10, I=1, NGRPS
7          IF (IGRP(I) .EQ. 3) IAREA3 = IAREA(I)
8   10  CONTINUE
9       IF (IAREA3 .EQ. 1) THEN
10          CALL SFSETR ('SP - SPACING BETWEEN FILL LINES', .006)
11          CALL SFNORM (XWRK, YWRK, NWRK, RSCR, 5000, ISCR, 5000)
12      ENDIF
13      RETURN
14      END

Arguments

APR
Subroutine---The Area-Processing Routine that is supplied by the user and called by ARSCAM. APR must be declared external in the routine that calls ARSCAM. APR must have the following form:
      SUBROUTINE APR (XWRK, YWRK, NWRK, IAREA, IGRP, NGRPS)
      DIMENSION XWRK(*), YWRK(*)
      DIMENSION IAREA(*), IGRP(*)
(code to process the area defined by XWRK, YWRK, IAREA, and IGRP)
      RETURN
      END
XWRK(NWRK), YWRK(NWRK)
Real arrays, Input---The X and Y coordinates, in the fractional coordinate system, of NWRK points defining a polygonal area. The last of these points is a duplicate of the first. Holes in an area are traced in such a way as to maximize the probability of hardware fill working properly by using vertical lines to get to and from the holes and tracing them in the proper direction.
NWRK
Integer, Input---The number of X and Y coordinates in the arrays XWRK and YWRK.
IAREA(NGRPS), IGRP(NGRPS)
Integer arrays, Input---Hold NGRPS pairs of identifiers for the area defined by XWRK and YWRK. For each value of I from 1 to NGRPS, IAREA(I) is the area identifier for the area with respect to the group of edges specified by the group identifier IGRP(I).
NGRPS
Integer, Input---Number of values in IAREA and IGRP. NGRPS equals the number of groups of edges that you put in the area map.

Discussion

In the ccpscam example, the area-processing routine is named SFILL. Lines 1 through 5 of the ccpscam.f code segment set up the calling sequence and arrays as defined by ARSCAM. They also set up two new scratch arrays, ISCR and RSCR, so that Softfill has some integer and real workspace to work with. Lines 6 through 8 retrieve the area identifier associated with group 3, our contour levels in this plot. Lines 9 through 12 draw the horizontal fill lines to fill the areas that we gave area identifier 1 in the previous module.

Exercises

  1. Modify SFILL in the ccpscam example so that it fills the region with a solid blue color rather than lines.
  2. Using exercise 2 from module "Cp 5.7 Filling contour levels," fill each contour level with a different pattern.

Cp 6. Contour line labels

Because of the complexity of the Conpack labeling scheme, labeling has been divided into two sections, by function:

Note: Many contour line label options are covered in section "Cp 7. General labels" because they share common parameters or functions with general labels.

Calls to set up contour line labels appear in four places in the Conpack functional outline:

Conpack functional outline

----------------------------------------------------------
    1.  Open GKS                                             
    2.  Set window and viewport                              
    3.  Put in titles and other labels                       
 *  4.  Set up general parameters                            
    5.  Set up area maps                                     
    6.  Initialize Conpack                                   
    7.  Force Conpack to choose contour levels if necessary  
 *  8.  Modify Conpack-chosen parameters                     
 *  9.  Draw labels                                          
    10.  Draw background                                     
 *  11.  Draw contour lines                                  
    12.  Call FRAME                                          
    13.  Close GKS                                           
----------------------------------------------------------
* Steps discussed in this section.
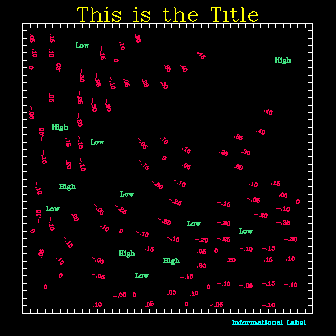
Cp 6.1 Drawing labels

Conpack produces several types of labels for contour plots: contour line labels, labels for the high and low points in your plot, and an information label. You must call the CPLBDR routine to draw any of these labels, except for the contour line labels that are drawn by default. Other utilities produce other types of labels used with contour plots; these are discussed in section "Cp 7. General labels."

Plot annotations

Code segment from ccplbdr.f

1       CALL CPRECT (Z, M, M, N, RWRK, LRWK, IWRK, LIWK)
2       CALL CPBACK (Z, RWRK, IWRK)
3       CALL CPLBDR (Z, RWRK, IWRK)

Synopsis

      CALL CPLBDR (ZREG, RWRK, IWRK)

Arguments

All three arguments to the CPLBDR call are arrays used in the last call to CPRECT, CPSPS1, or CPSPS2, the contents of which must not have been changed since that call. Since the dimensions of the following array are passed in common blocks, they are not shown here.

ZREG
Real array, Input---The densely gridded data array.
RWRK
Real array, Workspace---The real work array.
IWRK
Integer array, Workspace---The integer work array.

Discussion

CPLBDR may be called at any time after the initialization call to CPRECT, CPSPS1, or CPSPS2. If, during the last call to CPRECT, CPSPS1, or CPSPS2, the data being contoured were found to be essentially constant, then the constant field label is drawn. Otherwise, the information label, the high and low labels, and/or the contour line labels are drawn, as follows:

The parameters referring to high, low, and information labels in the preceding discussion are described in detail in section "Cp 7. General labels." Because of the complexity of contour line labeling schemes, section "Cp 6. Contour line labels" provides a detailed description of most of the contour line label options, and section "Cp 7. General labels" describes the rest of the contour line label options.

Line 1 of the ccplbdr.f code segment initializes Conpack. Line 2 draws a perimeter, and line 3 draws labels using CPLBDR. Notice that we don't call CPCLDR in this program. By not calling CPCLDR, contour lines are never drawn. Also, by not drawing the contours before calling CPLBDR to draw labels, the information label in the bottom right corner of the plot fails to get the information it needs to label minimum and maximum values as well as contour interval.
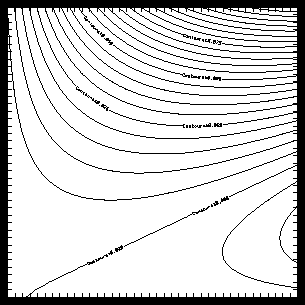
Exercises

  1. Add a CPLBDR call to the ccptitle example after the call to CPCLDR. Notice which of the labels are new. Why are contour line labels drawn before the call to CPLBDR is added?

Cp 6.2 Forcing labels to be chosen

Occasionally you need to force labels to be chosen so that you can modify specific line labels, or so that you can check a specific line label. The routine CPPKLB forces labels to be chosen.

Changing a specific line label

Code segment from ccpklb.f

1       CHARACTER*16 STRING
2       CALL CPRECT (Z, K, M, N, RWRK, LRWK, IWRK, LIWK)
3       CALL CPPKCL (Z, RWRK, IWRK)
4       CALL CPPKLB (Z, RWRK, IWRK)
5       CALL CPGETI ('NCL - NUMBER OF CONTOUR LEVELS', NOCL)
6       DO 10, I=1, NOCL
7          CALL CPSETI ('PAI - PARAMETER ARRAY INDEX', I)
8          CALL CPGETR ('CLV - CONTOUR LEVEL VALUES', CLVL)
9          WRITE (STRING, 5) CLVL
10         CALL CPSETC ('LLT - LINE LABEL TEXT STRING', STRING)
11  10  CONTINUE
12      CALL CPBACK (Z, RWRK, IWRK)
13      CALL CPCLDR (Z, RWRK, IWRK)
14   5  FORMAT ('Contour at ', F5.3)

Synopsis

      CALL CPPKLB (ZREG, RWRK, IWRK)

Arguments

All three arguments to the CPPKLB call are arrays used in the last call to CPRECT, CPSPS1, or CPSPS2, the contents of which must not have been changed since that call. Since the dimensions of the following arrays are passed in common blocks, they are not shown here.

ZREG
Real array, Input---The densely gridded data array.
RWRK
Real array, Workspace---The real workspace array.
IWRK
Integer array, Workspace---The integer workspace array.

Discussion

Normally, CPPKLB is called by Conpack when labels for the contour levels are needed. You can call CPPKLB directly (after the initialization call to CPRECT, CPSPS1, or CPSPS2) when you want to modify the resulting parameter arrays that specify the labels.

If the constant field found flag CFF is nonzero, indicating that the data were found to be essentially constant on the last call to CPRECT, CPSPS1 or CPSPS2, CPPKLB does nothing. Otherwise, CPPKLB examines the first NCL elements of the parameter array CLV (which defines the contour levels) and the associated parameter arrays, looking for levels that are to be labeled (CLU = 2 or 3) for which no label is specified (LLT = ' '). (The value of LLT is a single blank.) If any such levels are found, CPPKLB generates labels for them.

SFU, the scale factor used parameter, may be set as a by-product of choosing the labels. SFU and SFS, the scale factor selector parameter, are described in section "Cp 10. Conpack parameter descriptions." After calling CPPKLB, a user program may examine the generated labels and change them in various ways.

Line 2 of the ccpklb.f code segment initializes Conpack, and line 3 forces contour levels to be chosen. Line 4 forces labels to be picked so that we can modify those labels. Lines 6 through 8 retrieve each value of the contour lines, then the label is changed in line 10 to the string created in line 9. Lines 12 and 13 draw a perimeter and contour lines.
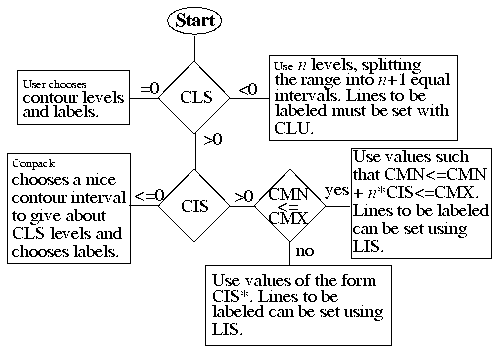
Cp 6.3 Selecting lines for labels: Default method

Default contour labels are drawn by the contour line drawing routine CPCLDR. Because of the interactivity of the default contour line drawing options and the default labeling options, these are discussed here again briefly. Default line labels are only chosen when CLS=CIS=0.0.

Default contour labels

Code segment from ccpcit.f

1       DATA CIT /1., 2., 3., 4., 5., 6., 7., 8., 9., 0./
2       DATA LIT /2,  2,  2,  2,  2,  2,  2,  2,  2,  0/
3       CALL OPNGKS
4       DO 101, I=1, 10
5          CALL CPSETI ('PAI - PARAMETER ARRAY INDEX', I)
6          CALL CPSETR ('CIT - CONTOUR INTERVAL TABLE', CIT(I))
7          CALL CPSETI ('LIT - LABEL INTERVAL TABLE', LIT(I))
8  101  CONTINUE
9       CALL CPRECT (Z, K, M, N, RWRK, LRWK, IWRK, LIWK)
10      CALL CPBACK (Z, RWRK, IWRK)
11      CALL CPCLDR (Z, RWRK, IWRK)

Synopsis

      CALL CPSETI ('PAI', n)
      CALL CPSETR ('CIT', cit)
      CALL CPSETI ('LIT', lit)
      CALL CPGETI ('LIU', liu)

Arguments

PAI
Integer---The Parameter Array Index must be set to specify the array element to be changed. For example, to change the third array element of LIT to 5, set PAI=3, then set LIT to 5.
CIT(10)
Real array---The Contour Interval Table parameter specifies what constitutes the "nice" value that Conpack is allowed to use as a contour interval. CIT can use values of the form "c times 10 to the power n", where c is one of the nonzero elements of CIT. (For example, if 2. occurs in CIT, it means that CONPACK can use a contour interval of 2 or 20 or 200 or .2 or .02 and so forth.) NCL is the Number of Contour Lines.
LIT(10)
Integer---The Label Interval Table parameter. For each element of CIT, the associated element of LIT specifies how far apart the labeled levels are. The default contents of CIT and LIT are:
-------------
PAI  CIT  LIT  
-------------
1    1.0  5    
2    2.0  5    
3    2.5  4    
4    4.0  5    
5    5.0  5    
6    0.0  0    
7    0.0  0    
8    0.0  0    
9    0.0  0    
10   0.0  0    
-------------
LIU
Integer---The Label Interval Used parameter allows you to retrieve n, where every nth contour level is labeled.

Discussion

Given the default values for CIT, we might obtain, in a given situation, a contour interval of 25 with every 4th level labeled, or a contour interval of 40 with every 5th level labeled. We could not get a contour level of 30, even though that might be desirable for more nearly the approximate number of levels desired.

Lines 1, 2, and 4 through 7 of the ccpcit.f code segment set CIT so that "nice" values are the same as they were in the old CONREC routine. LIT is set up to force every other contour level to be labeled no matter what. Lines 9 through 11 draw contours normally.
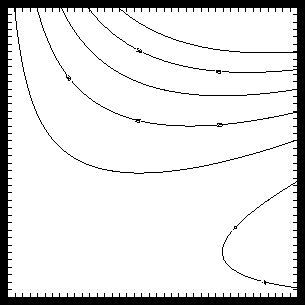
Exercises

  1. Using the ccpcit example, set Conpack so that no matter what contour interval is chosen, every third contour is labeled.
  2. Using the ccpcit example, set Conpack so that the default "nice" values are used, but so that each nice value has a different label interval.
  3. Using your program from exercise 2, use LIU to determine the label interval.

Cp 6.4 Selecting lines for labels: Labeling every nth line

Default contour labels are drawn by the contour line drawing routine CPCLDR. Because of the interactivity of the default contour line drawing options and the default labeling options, these are discussed here again briefly. If the CLS parameter is set so that Conpack chooses contour levels (CLS>0), then it is possible to mandate a contour interval using the CIS parameter. Using the LIS parameter, it is also possible to set the levels that are labeled.

Labeling fixed contour intervals

Code segment from ccpcis.f

1       CALL CPSETR ('CIS - CONTOUR INTERVAL SPECIFIER', 15.)
2       CALL CPSETI ('LIS - LABEL INTERVAL SPECIFIER', 2)
3       CALL CPSETR ('CMN - CONTOUR MINIMUM', -5.)
4       CALL CPSETR ('CMX - CONTOUR MAXIMUM', 75.)
5       CALL CPRECT (Z, K, M, N, RWRK, LRWK, IWRK, LIWK)
6       CALL CPBACK (Z, RWRK, IWRK)
7       CALL CPCLDR (Z, RWRK, IWRK)

Synopsis

      CALL CPSETR ('CIS', cis)
      CALL CPSETI ('LIS', lis)

Arguments

CIS
Real---The Contour Interval Specifier parameter. When CLS>0, as discussed in module "Cp 4.4 Default contour level selection," a CIS value of:
<=0 Conpack chooses the contour interval using the CIT table to choose a "nice" base value. This is the default.
>0 Conpack uses the value of CIS as the contour interval to be used. In this case, you may want to specify LIS to be some nonzero value to label every nth contour level.
If CLS<=0, then CIS is ignored.
LIS
Integer---The Label Interval Specifier parameter depends on the CLS and CIS parameters. When CLS>0 and CIS>0, then you may want to set LIS to specify the interval between labeled contour levels. LIS=5 by default.

Discussion

For example, if you specify CLS=1, CIS=1/3, and LIS=3, you would get contours at values like 1/3, 2/3, 3/3, 4/3, and so on, and labels on contour lines with values like 1.0, 2.0, 3.0, and so on.

Line 1 of the ccpcis.f code segment sets CIS to 15., then line 2 specifies labels on every other line. Lines 3 and 4 set the low and high contour levels to -5. and 75. Contours are set to n*CIS+CMN (in this case -5., 10., 25., ...).

The CMN and CMX parameters are documented in module "Cp 4.6 Default contour level selection: Fixed contour intervals and labels."
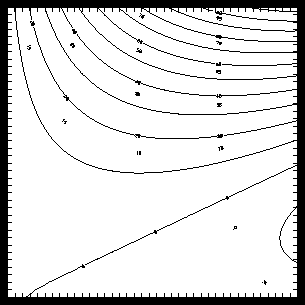
Exercises

  1. Using the ccpcis example, force Conpack to label every fourth contour level.

Cp 6.5 Selecting lines for labels: Labeling specific lines

In the same way that you can control specific values of individual contour lines, you can control exactly which lines are labeled. The CLU parameter controls this function and does two duties. It first determines whether or not a line will be drawn, then it determines if the line will be labeled. Control over the line-drawing aspect of the CLU parameter is discussed in module "Cp 4.14 Line attributes: Turning contour line drawing off and on."

Labeling individual contour lines

Code segment from ccpclu.f

1       CALL CPSETI ('CLS - CONTOUR LEVEL SELECTION FLAG', 0)
2       CALL CPSETI ('NCL - NUMBER OF CONTOUR LEVELS', 40)
3       DO 11, I=1, 40
4          CALL CPSETI ('PAI - PARAMETER ARRAY INDEX', I)
5          CALL CPSETR ('CLV - CONTOUR LEVEL VALUES', 5.0 * REAL (I) - 15.)
6          CALL CPSETI ('CLU - CONTOUR LEVEL USE FLAGS', MOD (I, 4))
7   11  CONTINUE
8       CALL CPRECT (Z, K, M, N, RWRK, LRWK, IWRK, LIWK)
9       CALL CPBACK (Z, RWRK, IWRK)
10      CALL CPCLDR (Z, RWRK, IWRK)

Synopsis

      CALL CPSETI ('CLU', iclu)

Arguments

CLU(NCL)
Integer array---Each element of the Contour Level Use flags parameter indicates how the contour level indicated by the associated element of the CLV array is to be used. NCL is the Number of Contour Levels.
0
No contour line or labels are drawn at this level.
1
A contour line is drawn without labels.
2
Contour labels are drawn but no line is drawn.
3
Both a contour line and labels are drawn.
Note: No labels are drawn on lines specifying special-value, edge-of-grid, or out-of-range lines (-3<=PAI<=-1).

Discussion

As shown in the ccpclu example, the following values are assigned to these parameters:

-----------------------
PAI  CLV(PAI)  CLU(PAI)  
-----------------------
1    -10.0     1         
2    -5.0      2         
3    0.0       3         
4    5.0       0         
5    10.0      1         
6    15.0      2         
-----------------------
Also notice that contour level -10.0 is a solid line, contour level -5.0 is labeled but not drawn, contour level 0.0 is drawn and labeled, and contour line 5.0 is neither drawn nor labeled, in accordance with the CLU parameter.

Line 1 of the ccpclu.f code segment tells Conpack that we will choose the contour levels. Line 2 sets the number of contour levels to 40, and lines 3 through 7 assign contour level values and set the CLU parameter to cycle through each of its four options. Lines 8 through 10 draw contours normally.
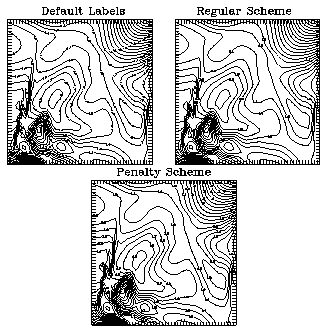
Exercises

  1. Modify the ccpclu example so that every contour line is drawn and labeled.

Cp 6.6 Three methods of label placement

Conpack provides three different ways to position labels on contour lines. You set the LLP parameter to choose one of these labeling schemes. The simplest method provides little control, and the most sophisticated method offers excellent control.

Three different labeling options

Code showing how to use the LLP parameter appears in label placement modules Cp 6.7 through Cp 6.9.4.

Synopsis

      CALL CPSETI ('LLP', llp)

Arguments

LLP
Integer---The Line Label Positioning flag has several options that specify the labeling method to be used.
0
No labels are drawn
1 or -1
Labels are positioned along contour lines by setting up a character dash pattern including the label and then drawing the contour with the Dashline utility. Although this is the least costly method, it has the disadvantages that you cannot control label orientation, and some labels may have other contour lines drawn through them. LLP = 1 by default.
Note: This scheme does not work if DPU is set to a value less than or equal to zero.
2
Labels are positioned along the contour using the moderate cost scheme discussed in module "Cp 6.8 Label placement: Regular scheme."
-2
Same as above, except that smoothing is suspended during label placement. This saves some CPU time and provides a set of labels that are nearly as good.
3
Labels are drawn using the more expensive penalty scheme discussed in the label placement penalty scheme modules Cp 6.9 through Cp 6.9.4.
-3
Same as above, except that smoothing is suspended during label placement. This saves some CPU time and provides a set of labels that are nearly as good.

Discussion

Since LLP=1 by default, every label drawn in sections "Cp 3. Initializing Conpack" and "Cp 4. Contour line basics" uses the inexpensive Dashline option. Review the preceding examples and note that labels are drawn by the CPCLDR subroutine when contours are drawn. When you set LLP to 2, -2, 3, or -3, then it is necessary to call CPLBDR to draw contour labels. The CPLBDR subroutine is discussed in section "Cp 7. General labels."

Also note that when you set LLP=1 or LLP=-1, the labels are actually included in the contour line. The other schemes perform the line labeling separate from the line drawing, and so should be used with the Areas utility to prevent writing over contour lines.
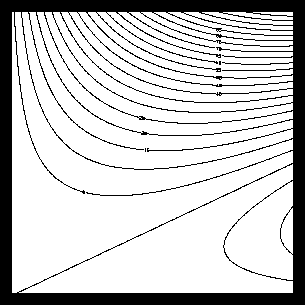
Cp 6.7 Label placement: Default method

By default, contour lines with labels are drawn by Dashline using a dash pattern followed by a label. This is the least expensive contour line labeling option, and can occasionally produce labels in awkward locations, or no labels at all on a given "labeled" line. When labels are in less than ideal locations, you may want to use either the regular scheme or or the penalty scheme method for labeling lines. However, when you get lines where labeling is "on," but no labels appear, you can often force labels to appear by modifying the RWC parameter.

Modifying label placement when using dense gridded data

Code segment from ccprwc.f

1       CALL CPRECT (Z, K, M, N, RWRK, LRWK, IWRK, LIWK)
2       CALL CPBACK (Z, RWRK, IWRK)
3       CALL CPPKCL (Z, RWRK, IWRK)
4       CALL CPGETI ('NCL - NUMBER OF CONTOUR LEVELS', NCL)
5       DO 10, I=1, NCL
6          CALL CPSETI ('PAI - PARAMETER ARRAY INDEX', I)
7          CALL CPSETI ('CLU - CONTOUR LEVEL USE FLAGS', 3)
8   10  CONTINUE
9       CALL CPSETI ('RWC - REAL WORKSPACE FOR CONTOURS', 125)
10      CALL CPCLDR (Z, RWRK, IWRK)

Synopsis

      CALL CPSETI ('RWC', irwc)

Arguments

RWC
Integer---The Real Workspace for Contours parameter specifies the amount of real workspace to be allotted to hold coordinates of points defining contour lines and associated quantities.
The value of RWC is normally of no particular interest to you, but when labels are placed on a line, the length of the portion of the contour line to be drawn in the default method is limited by the value of RWC. In this case, if labels don't appear on the line, increase RWC. Similarly, when using the penalty scheme, the length of the line over which the penalty function is evaluated is also limited by the value of RWC. In this case, if labels are placed too closely together, increase RWC.
RWC=100 by default.

Discussion

In the ccprwc example, the data points are extremely dense; this causes the labels to be drawn infrequently. You can increase the number of labels in this case by increasing the value of RWC.

Lines 1 and 2 of the ccprwc.f code segment initialize data and draw a background. Lines 3 through 8 force contour line labels to be turned on for each line. Line 9 sets RWC so that some contour labels are drawn and some are not, and line 10 draws the lines and labels.

The amount of real workspace that Conpack is allowed to use for coordinates of points on contour lines is determined by the value of the RWC parameter. By default, each contour line is drawn in pieces of no more than RWC points each. If you have a very dense grid, this means that the contour lines are drawn in rather short chunks (short as measured in NDCs).

Dashline restarts the dash pattern at the beginning of each chunk. What happens is that each chunk is of just the right length so that the dash pattern "$$$$$$$$0" never puts out a single "0," but the dash pattern "$$$$$$$$5" which is on a much longer line, does eventually write out a single "5."

By setting RWC=250, the size of the chunks doubles, and you start getting more labels.

Notice that if you increase RWC too much, you eventually have to make the real workspace larger.
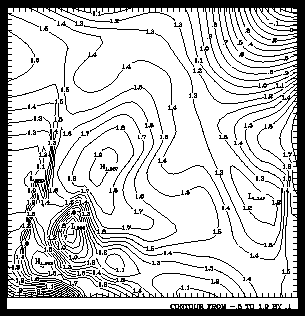
Exercises

  1. Using ccprwc.f, set RWC=100, then set RWC=250, and compare the plots for differences.

Cp 6.8 Label placement: Regular scheme

The regular scheme for labeling relies on three parameters and a random number generator to position labels. This method is somewhat more cumbersome and time consuming than the default method, but it generally gives better label placement.

Labels at moderate cost

Code segment from ccprc.f

1       CALL CPSETI ('LLP - LINE LABEL POSITIONING', 2)
2       CALL CPSETR ('RC1 - REGULAR SCHEME CONSTANT 1', .1)
3       CALL CPRECT (ZREG, MREG, MREG, NREG, RWRK, LRWK, IWRK, LIWK)
4       CALL CPPKCL (ZREG, RWRK, IWRK)
5       CALL CPGETI ('NCL - NUMBER OF CONTOUR LEVELS', NCONS)
6       DO 12, I=1, NCONS
7          CALL CPSETI ('PAI - PARAMETER ARRAY INDEX', I)
8          CALL CPSETI ('CLU - CONTOUR LEVEL USE FLAGS', 3)
9   12  CONTINUE
10      CALL CPLBDR (ZREG, RWRK, IWRK)

Synopsis

      CALL CPSETR ('RC1', rc1)
      CALL CPSETR ('RC2', rc2)
      CALL CPSETR ('RC3', rc3)

Arguments

RC1
Real---The Regular scheme Constant 1 parameter specifies the desired distance from the beginning of a contour line to the first label on that line when LLP=2 or -2. By default, RC1=.25 in viewport coordinates.
RC2
Real---The Regular scheme Constant 2 parameter specifies the desired nominal distance between labels when LLP=2 or -2. By default, RC2=.25 in viewport coordinates.
RC3
Real---The Regular scheme Constant 3 parameter specifies the desired maximum variation in the distance between labels when LLP=2 or -2. By default, RC3=.05 in viewport coordinates.

Discussion

The nth label on each labeled contour line will be at the distance RC1 + RC2 * (n-1) + RC3 * Rn, where RC1, RC2, and RC3 are described above, and Rn is a random number such that -1<Rn<1. Labels that would overlap the edge of the viewport or each other are omitted.

You can call CPLBAM to add label boxes for contour line labels to the area map; this prevents contour lines from passing through the labels. This is discussed in module "Cp 5.4 Adding label boxes to the area map."

Line 1 of the ccprc.f code segment tells Conpack that we want the moderately expensive labeling scheme. Line 2 sets the distance from the beginning of the contour line to the first label to be small, so that even short contour lines will be labeled. Line 3 initializes Conpack, and lines 4 through 9 force labeling of every line so that you can see the full effect of the labeling option. Line 10 draws the labels with a call to CPLBDR. You must use CPLBDR to draw labels when using the regular scheme for labeling.
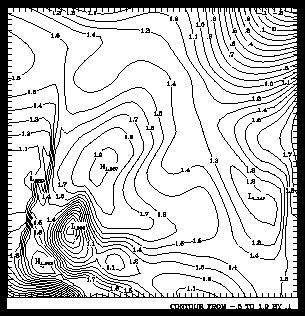
Exercises

  1. Run ccprc.f using default labels and compare the contour plot here with the results. Note that there are more lines with labels in this example.
  2. Using the ccprc example, set RC2 first to 0.1 NDCs, then to 0.4, and compare your plots.
  3. Using the ccprc example, set RC3 first to 0.01 NDCs, then to 1.0, and compare your plots.

Cp 6.9 Label placement: Penalty scheme

The "penalty scheme" label placement option is both the most complex of the three options and the most CPU intensive. However, it generally produces the best results. When the penalty scheme is used, contour lines are traced in order of increasing contour level. At each point on a contour line, several tests are performed; these tests are discussed below. After that, the penalty scheme function is evaluated at the remaining points, and labels are placed where the function returns the smallest value. The penalty scheme function is discussed in this and the next four modules.

Penalty scheme labels

Discussion

When ABS(LLP)=3, a penalty scheme (based on a scheme developed by Starley Thompson and Phil Rasch) is used. The contour lines are traced in order of increasing contour level. At each point along each line, several tests are performed; if the point fails any of the tests, no label is placed there. At the remaining points on the line, a penalty function is evaluated. A label is placed at the point where the penalty function has the smallest value. This process is repeated for each line until it results in the placement of no further labels. The contour line labels are drawn by a call to the label-drawing routine CPLBDR.

You can call CPLBAM to add label boxes for contour line labels to the area map; this prevents contour lines from passing through the labels. This is discussed in module "Cp 5.4 Adding label boxes to the area map."

The penalty scheme is controlled by the ten parameters PC1, PC2, PC3, PC4, PC5, PC6, PW1, PW2, PW3, and PW4. These constants are briefly described here as needed, and complete descriptions appear in the following modules.

The penalty scheme uses seven tests to determine if a point on a contour line is unacceptable as a location for a label. The point P on a contour line is rejected as the center point of a label under these conditions:

  1. There are fewer than three points on the contour. In this case, the number of points on a line refer to the number of points used to define a contour.
  2. The point P is too close to the center point of any other label on the same or an adjacent contour line, where the meaning of too close is defined by PC6. This test makes sure that labels are not placed too closely together.
  3. The label would extend outside the current viewport or contour rectangle.
  4. The label at point P would overlap any previous label. This applies both to labels on other contour levels and to labels on the same contour level.
  5. The estimated gradient of the field at point P is too large, where "too large" is defined by the value of PC1 and where PW1<>0. Labels are not drawn if the slope of the field is very steep and contour lines are close together.
  6. The estimated number of contour lines crossing a label at point P is too large, where "too large" is defined by the value of PC2 and where PW2<>0.
  7. The contour line has too sharp a bend at P, where "too sharp" is defined by PC3 and where PW3<>0. Labels are not placed on tight bends or sharp curves on a contour line.

Exercises

  1. Study the ccppc example and describe where some of the preceding tests might have failed.

Cp 6.9.1 Label placement: Penalty scheme---Gradient term

After a point passes the seven label-placement tests, Conpack can apply the penalty function to determine where labels may be placed. This penalty function uses the four terms shown in the chart below.

Conpack places labels at points on a contour line where PFUN is minimized. Because of the number of parameters involved, each term of the penalty function is discussed in separate modules. This module describes the gradient term.

-------------------------------------------------------------
PFUN=                                       Term               
-------------------------------------------------------------
PW1 * GRAD / (GRAV + PC1 * GRSD)            Gradient           
+ PW2 * ENCB / PC2                          Crossing contours  
+ PW3 * CDIR / PC3                          Tight curves       
+ PW4 * MIN (1 - EXP {-[(D(I)-PC4)/PC5]2})  Optimum distance   
-------------------------------------------------------------
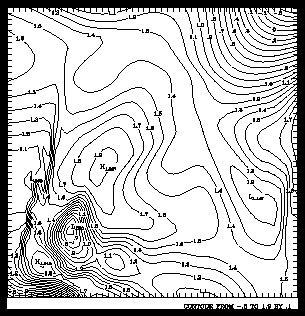
Effect of slope on label placement

Code segment from ccppc1.f

1       CALL CPSETI ('LLP - LINE LABEL POSITIONING', 3)
2       CALL CPSETR ('PC1 - PENALTY SCHEME CONSTANT 1', 3.0)
3       CALL CPRECT (ZREG, MREG, MREG, NREG, RWRK, LRWK, IWRK, LIWK)
4       CALL CPPKCL (ZREG, RWRK, IWRK)
5       CALL CPGETI ('NCL - NUMBER OF CONTOUR LEVELS', NCONS)
6       DO 12, I=1, NCONS
7          CALL CPSETI ('PAI - PARAMETER ARRAY INDEX', I)
8          CALL CPSETI ('CLU - CONTOUR LEVEL USE FLAGS', 3)
9   12  CONTINUE
10      CALL CPLBDR (ZREG, RWRK, IWRK)

Synopsis

      CPSETR ('PC1', pc1)
      CPSETR ('PW1', pw1)

Arguments

PC1
Real---The Penalty scheme Constant 1 parameter controls the largest gradient or slope allowed at the position of a label. PC1=1.0 by default, and it can take any positive real value. You should rarely need to set PC1>3.0.
PW1
Real---The Penalty scheme Weight 1 parameter specifies the weight or importance of the gradient term in the penalty function. PW1=2.0 by default, and any positive real value is valid.

Discussion

The gradient term of the penalty scheme is:

PW1 * GRAD / (GRAV + PC1 * GRSD)
where GRAD is the estimated gradient at the point P, GRAV is the average gradient over the whole field being contoured, and GRSD is the standard deviation of the estimated gradients over the whole field. PC1 specifies, as a multiple of the standard deviation, how far the gradient at point P is allowed to be from the average gradient before it prevents P from being considered as a label position. And PW1 specifies the weight of the gradient term in the penalty function.

This means that labels are not placed on steep slopes going down, nor on steep slopes going up. If you want labels on the steep slopes, you have two choices: you can either make PC1 larger or you can set PW1=0.0. By increasing PC1, you increase the steepness of a slope that can be labeled. By decreasing PW1, you reduce the importance of the slope in the labeling scheme.

To simplify the weighting of terms, the base part of each term is always between 0.0 and 1.0 inclusive. 0.0<=GRAD/(GRAV+PC1*GRSD)<=1.0. If you want to make the gradient term twice as important as the other terms in the penalty function, set PW1=2.0, and PW2, PW3, and PW4=1.0. Or, if you only care about making sure that labels are not placed on the steep parts of fields, set PW1=1.0, and PW2, PW3, and PW4=0.0.

Line 1 of the ccppc1.f code segment chooses the penalty scheme labeling option by setting LLP=3. Line 2 sets the gradient constant so that any lines on a steep slope may be labeled. Line 4 initializes Conpack. Lines 5 through 9 turn on line labeling for every line. Notice that line 10 draws labels by calling CPLBDR; penalty scheme labels must be drawn with CPLBDR.

Exercises

  1. Using the ccppc1 example, set PC1=.5, 1.5, and 2.0 in three different runs or frames, and compare the differences in the plots.
  2. Using the ccppc1 example, set PW1=0.0, 1.0, and 5.0 in three different runs or frames, and compare the differences in the plots.

Cp 6.9.2 Label placement: Penalty scheme---Crossing contours

After a point passes the seven label-placement tests, Conpack can apply the penalty function to determine where labels may be placed. This penalty function uses the four terms shown in the chart below.

Conpack places labels at points on a contour line where PFUN is minimized. Because of the number of parameters involved, each term of the penalty function is discussed in separate modules. This module describes the crossing contours term.

-------------------------------------------------------------
PFUN=                                       Term               
-------------------------------------------------------------
PW1 * GRAD / (GRAV + PC1 * GRSD)            Gradient           
+ PW2 * ENCB / PC2                          Crossing contours  
+ PW3 * CDIR / PC3                          Tight curves       
+ PW4 * MIN (1 - EXP {-[(D(I)-PC4)/PC5]2})  Optimum distance   
-------------------------------------------------------------
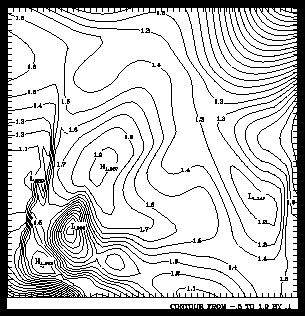
Effect of line spacing on label placement

Code segment from ccppc2.f

1       CALL CPSETI ('LLP - LINE LABEL POSITIONING', 3)
2       CALL CPSETR ('PC2 - PENALTY SCHEME CONSTANT 2', 1.0)
3       CALL CPSETR ('PW2 - PENALTY SCHEME WEIGHT 2', 1.0)
4       CALL CPRECT (ZREG, MREG, MREG, NREG, RWRK, LRWK, IWRK, LIWK)
5       CALL CPPKCL (ZREG, RWRK, IWRK)
6       CALL CPGETI ('NCL - NUMBER OF CONTOUR LEVELS', NCONS)
7       DO 12, I=1, NCONS
8          CALL CPSETI ('PAI - PARAMETER ARRAY INDEX', I)
9          CALL CPSETI ('CLU - CONTOUR LEVEL USE FLAGS', 3)
10  12  CONTINUE
11      CALL CPLBDR (ZREG, RWRK, IWRK)

Synopsis

      CPSETR ('PC2', pc2)
      CPSETR ('PW2', pw2)

Arguments

PC2
Real---The Penalty scheme Constant 2 parameter specifies the maximum estimated number of contour bands allowed to cross a label. PC2=5.0 by default.
PW2
Real---The Penalty scheme Weight 2 parameter specifies the weight (or importance) of the "crossing contours" term in the penalty function. PW2=0.0 by default.

Discussion

The "crossing contours" term of the penalty function becomes larger as ENCB increases. ENCB is the estimated number of contour lines crossing a label at point P. PC2 specifies the largest number of lines that a contour label is allowed to cross. By increasing the value of the Conpack parameter RWG, you can increase the accuracy of ENCB.

In many senses, the gradient and "crossing contours" terms of the penalty function represent the same thing. Any locations where contour lines are close enough together for labels to cross them are also regions having a relatively steep slope.

To simplify the weighting of terms, the base part of each term is always between 0.0 and 1.0 inclusive. In other words, 0.0<=ENCB / PC2<=1.0. If you want to make the crossing contours term twice as important as the other terms in the penalty function, set PW2=2.0, and PW1, PW3, and PW4=1.0. Or, if you only care about making sure labels do not cross contour lines, set PW2=1.0, and PW1, PW3, and PW4=0.0.

By default, PW2=0.0; this allows labels to cross any number of contour lines. If you want to change it so that labels are unlikely to cross contour lines, set PW2>=1.0, and PC2=1.0, as shown in the ccppc2.f code segment.

Line 1 of the ccppc2.f code segment chooses the penalty scheme labeling option by setting LLP=3. Line 2 sets the crossing contours constant so that labels do not cross contour lines. Line 3 changes the weighting function so that this option is observed. Line 4 initializes Conpack. Lines 5 through 10 turn on line labeling for every line. Notice that line 11 draws labels by calling CPLBDR; penalty scheme labels must be drawn with CPLBDR.

Exercises

  1. Using the ccppc2 example, set PC2=2.0, 3.0, and 4.0 in three different runs or frames, and compare the differences in the plots.
  2. Using the ccppc2 example, set PW2=0.5, 1.5, and 5.0 in three different runs or frames, and compare the differences in the plots.

Cp 6.9.3 Label placement: Penalty scheme---Tight curves

After a point passes the seven label-placement tests, Conpack can apply the penalty function to determine where labels may be placed. This penalty function uses the four terms shown in the chart below.

Conpack places labels at points on a contour line where PFUN is minimized. Because of the number of parameters involved, each term of the penalty function is discussed in separate modules. This module describes the "tight curves" term.

-------------------------------------------------------------
PFUN=                                       Term               
-------------------------------------------------------------
PW1 * GRAD / (GRAV + PC1 * GRSD)            Gradient           
+ PW2 * ENCB / PC2                          Crossing contours  
+ PW3 * CDIR / PC3                          Tight curves       
+ PW4 * MIN (1 - EXP {-[(D(I)-PC4)/PC5]2})  Optimum distance   
-------------------------------------------------------------
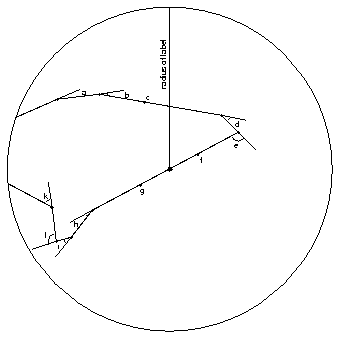
What constitutes a tight curve

Code segment from ccppc3.f

1       CALL CPSETI ('LLP - LINE LABEL POSITIONING', 3)
2       CALL CPSETR ('PC3 - PENALTY SCHEME CONSTANT 3', 10.0)
3       CALL CPSETR ('PW3 - PENALTY SCHEME WEIGHT 3', 2.0)
4       CALL CPRECT (ZREG, MREG, MREG, NREG, RWRK, LRWK, IWRK, LIWK)
5       CALL CPPKCL (ZREG, RWRK, IWRK)
6       CALL CPGETI ('NCL - NUMBER OF CONTOUR LEVELS', NCONS)
7       DO 12, I=1, NCONS
8          CALL CPSETI ('PAI - PARAMETER ARRAY INDEX', I)
9          CALL CPSETI ('CLU - CONTOUR LEVEL USE FLAGS', 3)
10  12  CONTINUE
11      CALL CPLBDR (ZREG, RWRK, IWRK)

Synopsis

      CALL CPSETR ('PC3', pc3)
      CALL CPSETR ('PW3', pw3)

Arguments

PC3
Real---The Penalty scheme Constant 3 parameter specifies, in degrees, the maximum cumulative change in direction to be allowed along that portion of the contour line covered by a circle centered on a label and having a radius equal to half the width of the label. PC3=60.0 by default.
PW3
Real---The Penalty scheme Weight 3 parameter specifies the weight (importance) of the "tight curves" term in the penalty function. PW3=1.0 by default.

Discussion

The "tight curves" term of the penalty scheme is:

PW3 * CDIR / PC3
where CDIR is the cumulative change in the direction of the contour line in a circular region centered at the point P with a radius equal to half of the largest dimension of the label. PC3 specifies the largest such cumulative change allowed in degrees. The illustration shows that CDIR is the sum of the angles specifying the change in direction of the contour inside the label circle (CDIR=a+b+c+d+e+f+g+h+i, where c, f, and g are zero in the illustration).

By default, PC3=60.0, so a contour line cannot bend more than 60 degrees within the diameter of the label if a label is to be placed at that point. The idea is that labels should not cover up interesting details of contour lines.

To simplify the weighting of terms, the base part of each term is always between 0.0 and 1.0 inclusive. In other words, 0.0 <= CDIR / PC3 <= 1.0. If you want to make the tight curves term twice as important as the other terms in the penalty function, set PW3=2.0, and PW1, PW2, and PW4=1.0. Or, if you only care about making sure that labels are not placed on tight bends, set PW3=1.0, and PW1, PW2, and PW4=0.0.

The ccppc3 example follows much the same form as ccppc1 and ccppc2, and it illustrates the use of PC3 and PW3. Study these examples to determine the differences.

Exercises

  1. Using the ccppc3 example, set PC3=30.0, 90.0, and 180.0 in three different runs or frames, and compare the differences in the plots.
  2. Using the ccppc3 example, set PW3=0.0, 1.5, and 5.0 in three different runs or frames, and compare the differences in the plots.

Cp 6.9.4 Label placement: Penalty scheme---Label spacing

After a point passes the seven label-placement tests, Conpack can apply the penalty function shown below to determine where labels may be placed.

Conpack places labels at points on a contour line where PFUN is minimized. This module describes the optimum distance term.

-------------------------------------------------------------
PFUN=                                       Term               
-------------------------------------------------------------
PW1 * GRAD / (GRAV + PC1 * GRSD)            Gradient           
+ PW2 * ENCB / PC2                          Crossing contours  
+ PW3 * CDIR / PC3                          Tight curves       
+ PW4 * MIN (1 - EXP {-[(D(I)-PC4)/PC5]2})  Optimum distance   
-------------------------------------------------------------
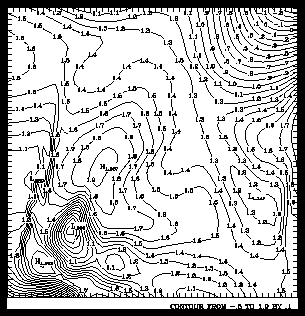
Effect of optimum distance on label placement

Code segment from ccppc4.f

1       CALL CPSETI ('LLP - LINE LABEL POSITIONING', 3)
2       CALL CPSETR ('PC4 - PENALTY SCHEME CONSTANT 4', 0.1)
3       CALL CPSETR ('PC5 - PENALTY SCHEME CONSTANT 5', 0.2)
4       CALL CPSETR ('PC6 - PENALTY SCHEME CONSTANT 6', 0.05)
5       CALL CPSETR ('PW4 - PENALTY SCHEME WEIGHT 4', 5.0)
6       CALL CPRECT (ZREG, MREG, MREG, NREG, RWRK, LRWK, IWRK, LIWK)
7       CALL CPPKCL (ZREG, RWRK, IWRK)
8       CALL CPGETI ('NCL - NUMBER OF CONTOUR LEVELS', NCONS)
9       DO 12, I=1, NCONS
10         CALL CPSETI ('PAI - PARAMETER ARRAY INDEX', I)
11         CALL CPSETI ('CLU - CONTOUR LEVEL USE FLAGS', 3)
12  12  CONTINUE
13      CALL CPLBDR (ZREG, RWRK, IWRK)

Synopsis

      CALL CPSETR ('PC4', pc4)
      CALL CPSETR ('PC5', pc5)
      CALL CPSETR ('PC6', pc6)
      CALL CPSETR ('PW4', pw4)

Arguments

PC4
Real---The Penalty scheme Constant 4 parameter specifies the optimal label spacing as a fraction of the viewport width. PC4=0.05 by default.
PC5
Real---The Penalty scheme Constant 5 parameter is a "folding distance;" it helps place labels at an optimal distance from each other. PC5=0.15 by default.
PC6
Real---The Penalty scheme Constant 6 parameter specifies the minimum distance allowed between any two labels on the same contour line, as a fraction of the viewport width. PC6=0.3 by default.
PW4
Real---The Penalty scheme Weight 4 parameter specifies the weight (importance) of the optimum distance terms (PC4, PC5, and PC6) in the penalty function. PW4=1.0 by default.
To simplify weighting, the base part of each term is always between 0.0 and 1.0 inclusive. 0.0 <= MIN(1-EXP{-[(D(I)-PC4)/PC5]2} <= 1.0.

Discussion

The optimum distance term of the penalty function becomes small when the distance of the point P from the center of some labels previously placed on another contour line matches the optimum value specified by PC4. D(I) represents the distance to the Ith such label center. The minimum is taken over all values of I. If point P is exactly PC4 units away from some previous label, then MIN (1EXP(...)) has the value 0; if not, it may get as large as 1.0. PC5, also expressed as a fraction of the viewport width, limits how far labels can be placed from the optimal distance, and PC6 limits how closely together labels can be placed.

Let the penalty term be written as:

For a given label Li, the penalty would be:

where di is the distance from the point P (under consideration) to the center of Li. "di-PC4" is the amount by which that distance differs from the desired optimum value. The following table may help explain what PC5 does:

--------------------------------------------
| di - PC4 |  penalty  | di - PC4 |  penalty  
--------------------------------------------
0.            0.                              
.25*PC5       .06059   1.25*PC5      .79039   
.50*PC5       .22120   1.50*PC5      .89460   
.75*PC5       .43022   1.75*PC5      .95323   
1.00*PC5      .63212   2.00*PC5      .98168   
--------------------------------------------
One problem is that, if you make PC5 too small, it may happen that no point P you consider gives you a penalty less than .99, so you will be using the best of a bad lot.

The ccppc4 example follows much the same form as ccppc1, ccppc2, and ccppc3; it illustrates the use of PC4, PC5, PC6, and PW4. Study these examples to determine the differences.
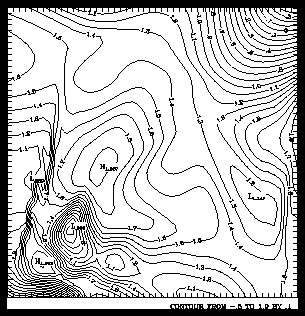
Exercises

  1. Using the ccppc4 example, set the optimum distance parameters so that most lines have only one label.

Cp 6.10 Label attributes: Angle and orientation

If you are using the regular scheme or the penalty scheme for labeling your lines, you can change the angle or orientation of the labels on your contours. with the LLA and LLO parameters.

Labels parallel to contours

Code segment from ccpllo.f

1       CALL CPSETI ('LLP - LINE LABEL POSITIONING', 3)
2       CALL CPSETI ('LLO - LINE LABLE ORIENTATION', 1)
3       CALL CPRECT (ZREG, MREG, MREG, NREG, RWRK, LRWK, IWRK, LIWK)
4       CALL CPPKCL (ZREG, RWRK, IWRK)
5       CALL CPGETI ('NCL - NUMBER OF CONTOUR LEVELS', NCONS)
6       DO 12, I=1, NCONS
7          CALL CPSETI ('PAI - PARAMETER ARRAY INDEX', I)
8          CALL CPSETI ('CLU - CONTOUR LEVEL USE FLAGS', 3)
9   12  CONTINUE
10      CALL CPLBDR (ZREG, RWRK, IWRK)

Synopsis

      CALL CPSETR ('LLA', rlla)
      CALL CPSETI ('LLO', llo)

Arguments

LLA
Real---The Line Label Angle parameter is only used when you are using the regular or penalty scheme of line labeling (LLP=2, -2, 3, or -3). LLP is the angle in degrees at which contour line labels are to be written. LLA=0.0 by default.
LLO
Integer---The Line Label Orientation parameter is only used when you are using the regular or penalty scheme of line labeling (LLP=2, -2, 3, or -3).
0 All labels are written at the angle specified by LLA. This is the default.
<>0 Each label is written parallel to the tangent to the contour line at the center of the label. In other words, labels are written parallel to the contour line.
By default, all labels are written horizontally, no matter what direction contour lines are running at the point of the label.

Discussion

Line 1 of the ccpllo.f code segment sets the labeling scheme to the penalty scheme, thereby enabling LLA and LLO. Line 2 sets LLO=1 so that labels are drawn parallel to the contour line. Conpack is then initialized, contour lines are chosen, and lines 5 through 9 turn on line labeling for every line. Line 10 draws labels using the call to CPLBDR since we are not using the default labels.

Compare the results here with the plot in module "Cp 6.9 Label placement: Penalty scheme."
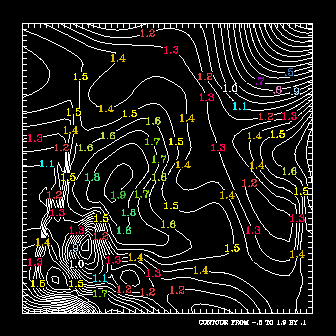
Exercises

  1. Using the ccpllo example, set all line labels so that they are at a 30-degree angle from horizontal.
  2. Using the ccprc example, set all line labels so that they run parallel to the contours.

Cp 6.11 Label attributes: Color

Contour line label color is controlled by the LLC parameter and the GKS color setting routine GSCR. LLC is a parameter array, allowing you to choose different label colors for each contour level.

Coloring contour line labels

Code segment from ccpllc.f

1       CALL COLOR
2       CALL CPRECT (ZREG, MREG, MREG, NREG, RWRK, LRWK, IWRK, LIWK)
3       CALL CPPKCL (ZREG, RWRK, IWRK)
4       CALL CPGETI ('NCL - NUMBER OF CONTOUR LEVELS', NCONS)
5       CALL CPSETI ('LLP - LINE LABEL POSITIONING', 2)
6       CALL CPSETR ('LLS - LINE LABEL SIZE', .02)
7       CALL CPSETC ('HLT - HIGH/LOW LABEL TEXT STRINGS', ' '' ')
8       DO 11, I=1, NCONS
9          CALL CPSETI ('PAI - PARAMETER ARRAY INDEX', I)
10         CALL CPSETI ('CLU - CONTOUR LEVEL USE FLAGS', 3)
11         CALL CPSETI ('LLC - LINE LABEL COLOR INDEX', MOD (I, 16) + 1)
12  11  CONTINUE
13      CALL CPBACK (ZREG, RWRK, IWRK)
14      CALL CPCLDM (ZREG, RWRK, IWRK, MAP, CPDRPL)
15      CALL CPLBDR (ZREG, RWRK, IWRK)
16
17      SUBROUTINE COLOR
18      CALL GSCR (1, 0, 0., 0., 0.)
19      CALL GSCR (1, 1, 1.0, 1.0, 1.0)
20      CALL GSCR (1, 2, 0.0, 0.9, 1.0)
21      CALL GSCR (1, 3, 0.9, 0.25, 0.0)
22      CALL GSCR (1, 4, 1.0, 0.0, 0.2)
23      CALL GSCR (1, 5, 1.0, 0.65, 0.0)
24      CALL GSCR (1, 6, 1.0, 1.0, 0.0)

Synopsis

      CALL CPSETI ('LLC', llc)

Arguments

LLC(NCL)
Integer array---The Line Label Color parameter array is an array of color indices, each element of which specifies the color for labels on contour lines at the level specified by the associated element of the parameter array CLV. NCL is the Number of Contour Levels. If the value of an element of LLC is:
>=0 The color index for labels on the contour line specified by the associated element of CLV.
<0 The current text color is to be used.

Discussion

Accessing each element of the LLC array is done by setting the PAI parameter, as shown in line 9 of the ccpllc.f code segment. For a complete description of the PAI parameter and how it works, see module "Cp 1.6 Conpack parameters: What they do and how to use them."

Line 1 of the ccpllc.f code segment sets up a color table using the subroutine named "color," partially defined in lines 17 through 24. A complete discussion of setting up a color table appears in Chapter 7 "Color tables and color mapping systems" of the NCAR Graphics Fundamentals guide. Line 2 of the code segment initializes Conpack, and line 3 picks contour levels so that we can force labeling of every line in lines 8 through 12.

Line 5 selects the regular scheme for labeling so that the color attribute is used, and line 11 chooses colors by cycling through the color table. Line 6 enlarges the label size to make the labels more visible over the contour lines, and line 7 turns off high and low labels to emphasize the desired labels. High and low label options are discussed in module "Cp 6.1 Drawing labels." Note that contour lines are masked in line 14.
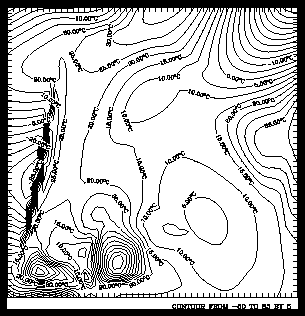
Exercises

  1. Using the ccpllc example, make all the lines turquoise.
  2. Using the ccpllc example, make all the lines above zero green, the zero line purple, and the negative lines blue.

Cp 6.12 Label attributes: Label text options

There are two label text options that can be used with the regular or penalty labeling scheme (LLP=2, -2, 3, or -3). You can control the size of the label, and you can control the text of the label.

Changing label text and size

Code segment from ccpllt.f

1       CALL CPRECT (ZREG, MREG, MREG, NREG, RWRK, LRWK, IWRK, LIWK)
2       CALL CPPKCL (ZREG, RWRK, IWRK)
3       CALL CPGETI ('NCL - NUMBER OF CONTOUR LEVELS', NCONS)
4       CALL CPSETI ('LLP - LINE LABEL POSITIONING', 2)
5       CALL CPSETC ('HLT - HIGH/LOW LABEL TEXT STRINGS', ' '' ')
6       CALL CPSETI ('LLO - LINE LABEL ORIENTATION', 1)
7       DO 11, I=1, NCONS
8          CALL CPSETI ('PAI - PARAMETER ARRAY INDEX', I)
9          CALL CPSETI ('CLU - CONTOUR LEVEL USE FLAGS', 3)
10         CALL CPGETR ('CLV - CONTOUR LEVEL VALUES', VALUE)
11         WRITE (STRING, 5) VALUE
12         CALL CPSETC ('LLT - LINE LABEL TEXT STRING', STRING)
13  11  CONTINUE
14      CALL CPBACK (ZREG, RWRK, IWRK)
15      CALL CPCLDM (ZREG, RWRK, IWRK, MAP, CPDRPL)
16      CALL CPLBDR (ZREG, RWRK, IWRK)
17   5  FORMAT (F6.2, ':SRIL:O:N:C', F6.2)

Synopsis

      CALL CPSETC ('LLT', cllt)

Arguments

LLT(NCL)
Character*20 array---The Line Label Text string parameter allows you to specify a different label of up to 20 characters for each contour line. The Ith element of LLT specifies the label for the contour specified by the Ith value of CLV, regardless of the order of the values in the CLV array. Since the label is drawn using the Plotchar utility, you may use colon-enclosed function codes to create subscripts, use Greek characters, or use other Plotchar options. By default, Conpack chooses the value of the contour level as its label.
LLS
Real---The Line Label Size parameter specifies the size (width) of a character in a contour line label as a fraction of the width of the viewport. This nominal size is multiplied by CWM.
CWM
Real---All label sizes are multiplied by the Character Width Multiplier parameter. This makes it easy to scale the sizes of each type of label up and down with respect to the others, or to increase and decrease all label sizes at once. CWM=1.0 by default.

Discussion

LLS is defined as a fraction of the viewport width: 0.0<LLS<1.0. If you set LLS=1.0, and CWM=1.0, you would find that each character is as wide as the viewport.

The LLT parameter allows you to give each contour line a label of your choice. In the ccpllt example, each contour level value is followed by "oC". Long labels are not terribly useful in publication-quality plots because they don't follow the curves of the contours. By default, Conpack prints the value of the level as the label, with numbers represented in the form discussed in the numeric control modules Cp 7.3 through Cp 7.5.

Line 1 of the ccpllt.f code segment initializes Conpack for regularly spaced data, and line 2 forces the choosing of contour levels so that we can turn on labeling for each line in line 11. Line 4 chooses the regular labeling scheme so that the text options will be used. Line 5 turns off high and low labels to show the contour labels more clearly. This option is described in module "Cp 6.1 Drawing labels."

Line 6 forces labels to be placed parallel to the contour line being labeled. Line 10 retrieves the value of the contour level so that we can make a meaningful label for each line. Line 11 does an internal write to the variable string so that each line is labeled with its index in the CLV array. Line 12 sets up the label array so that each line is given the appropriate label. In lines 14 through 16, a background is drawn using CPBACK, contours are drawn by CPCLDM, and labels are drawn with a call to CPLBDR, as this tutorial has now demonstrated many times. Line 17 provides a format for the contour line label text and places the "degrees Celcius" symbol after the contour line value.

Exercises

  1. Change the notation in the ccpllt example so that the value of each contour level is followed by "°F".
Previous Chapter          Tutorial Home          Next Chapter