Previous chapter LLUs Home Next chapter IndexMost modern graphics display devices use raster image technology. This means that the physical display surface is made up of a two-dimensional array of pixels, each of which can receive a color value. A displayed picture is nothing more than the aggregate setting and display of all physical pixel color values.
The GKS graphics standard (see the User's Guide for NCAR GKS-0A Graphics for details on GKS) abstracts the concept of a raster image in its cell array function. This function can be invoked, alongside any other NCAR Graphics function, to draw a two-dimensional array of colored rectangles. This array may be of arbitrary size.


1       CALL GSCR(1,0,1.,1.,1.)
2       CALL GSCR(1,1,1.,1.,1.)
3       CALL GSCR(1,2,1.,0.,0.)
4       CALL GSCR(1,3,0.,1.,0.)
5       CALL GSCR(1,4,0.,0.,1.)
6       CALL GSCR(1,5,0.,1.,1.)
7       CALL GSCR(1,6,1.,0.,1.)
8       CALL GSCR(1,7,1.,1.,0.)
9       DO 10 I=1,IDX
10           DO 20 J=1,IDY
11              COLIA(I,J) = IDY*(I-1)+J+1
12  20       CONTINUE
13  10  CONTINUE
14      CALL GCA(0.10, 0.25, 0.90, 0.75, IDX, IDY, 1, 1, IDX, IDY, COLIA)
CALL GCA (PX, PY, QX, QY, DIMX, DIMY, ISC, ISR, DX, DY, COLIA)
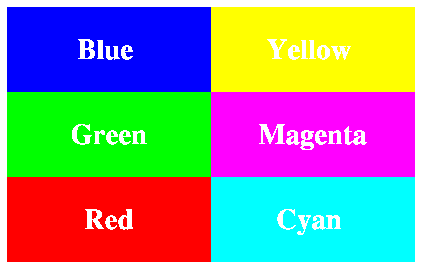
Lines 1 through 8 of the fcell0.f code segment set up a color table that associates color values with color indices. See the "Color tables and color mapping systems" chapter in this document for details on setting up a color table. An unusual feature of this color table is that the foreground color (color index 1) and the background color (color index 0) are both defined to be white. This is because a white background was desired and the foreground color is used to write text on top of colors that are different from the background color.
Lines 9 through 13 define the color index array where IDX=2 and IDY=3. The six color indices from 2 through 7 are used. These indices are associated with the primary and secondary colors in the color table.
Line 14 calls GCA to produce the cell array. The black-and-white reproduction is less than optimal, so we have used Plotchar to label the cells to indicate what colors you would see if you plotted this picture on a color device.
Cell arrays provide for a way of displaying raster image data along with text, lines, markers, and filled areas. Some data are more suitable for display as a raster image. For example, you may have data from scientific equipment that is in the form of an array of color intensities. Or you may have a screen dump from a graphics output device that is in the form of a raster image. These arrays would have to be converted to a form suitable for using GCA, but once that is done you can integrate such data with the rest of NCAR graphics and display them on multiple output devices.
One disadvantage in using GCA is the case where the resolution of the cell array is not well matched with the resolution of the graphics output device. In this case you may see some "jaggies" or "staircasing" that are consequences of the algorithm that converts the cell array to the raster image on the screen. You could make the size of the cell array match the resolution of a desired output device, but that defeats the intended portability of GCA.
Previous chapter LLUs Home Next chapter Index