Scientific Visualizations
by
Eliot Feibush
by
Eliot Feibush
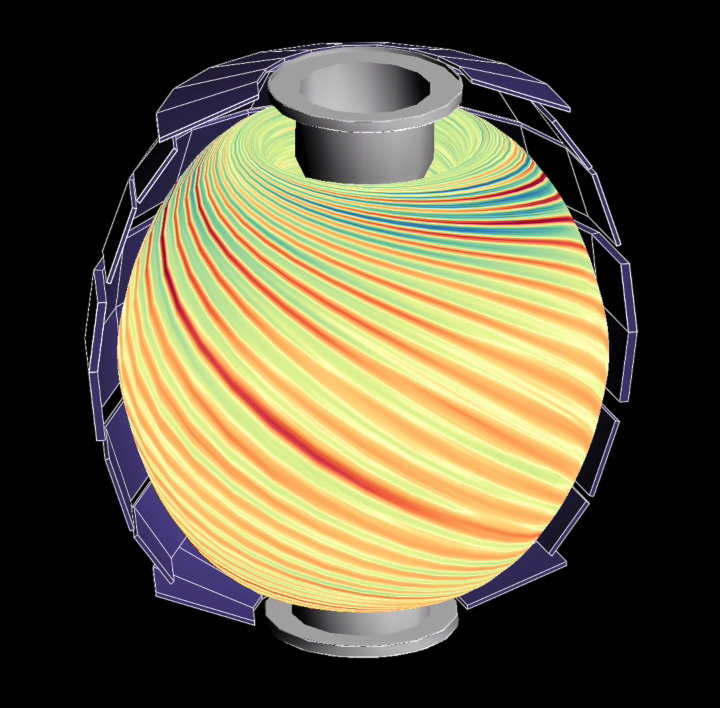
The Gyrokinetic Tokamak Simulation code uses fieldline following coordinates.
None of the existing visualization packages handle this coordinate system directly.
Considerable development has gone into selecting data efficiently from very large GTS data sets and mapping it to
visualization plot types. Nested flux surfaces are also challenging due to the unstructured grid.
Applying Delauney triangulation on a ring-by-ring basis has generated effective visualizations.
Phi is rendered relative to the NSTX-U center stack and plasma facing components.
The GTS animation shows visualization techniques for exploring data that is f(x,y,z,t).
Play GTS Animation (includes audio narration) GTS Workflow screenshot
Turbulence-Generated Intrinsic Rotation
Ion Density, Temperature, and Flow

The Rayleigh-Taylor simulation works with data on a 3-D compute grid.
The animation shows visualization techniques for exploring data that is f(x,y,z).
Python scripts were developed to produce each frame of the animation.
Play 3-D Animation (includes audio narration)
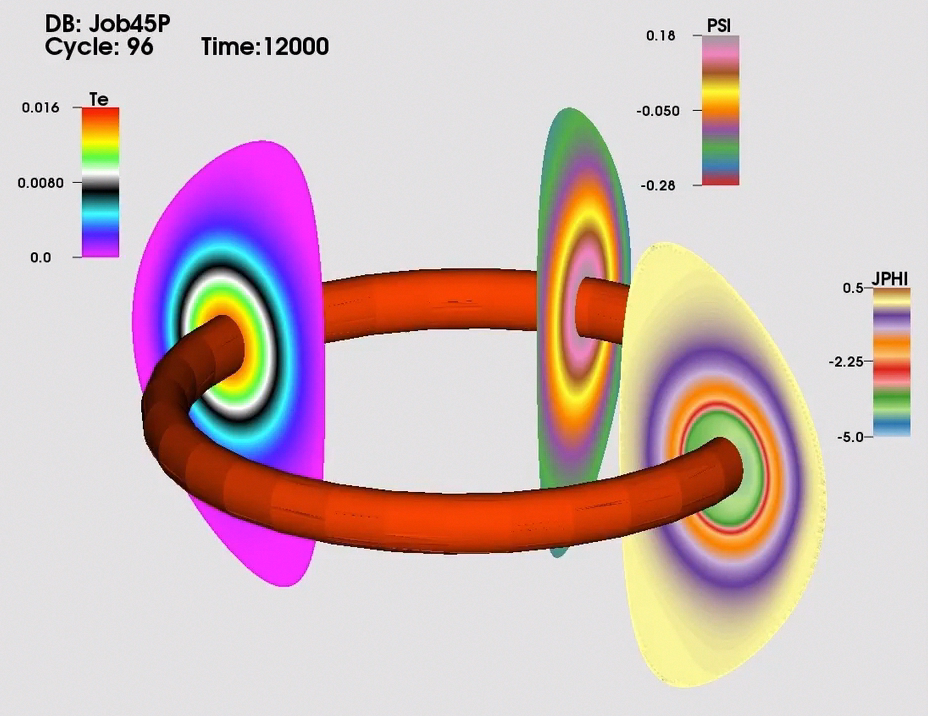
The M3D-C1 visualization shows 3 parameters computed on poloidal planes and an isosurface for Te = .015 at a
particular time step. The animation shows these values simultaneously as f(x,y,z,t).
Play M3D-C1 Animation M3D-C1 visualization instructions
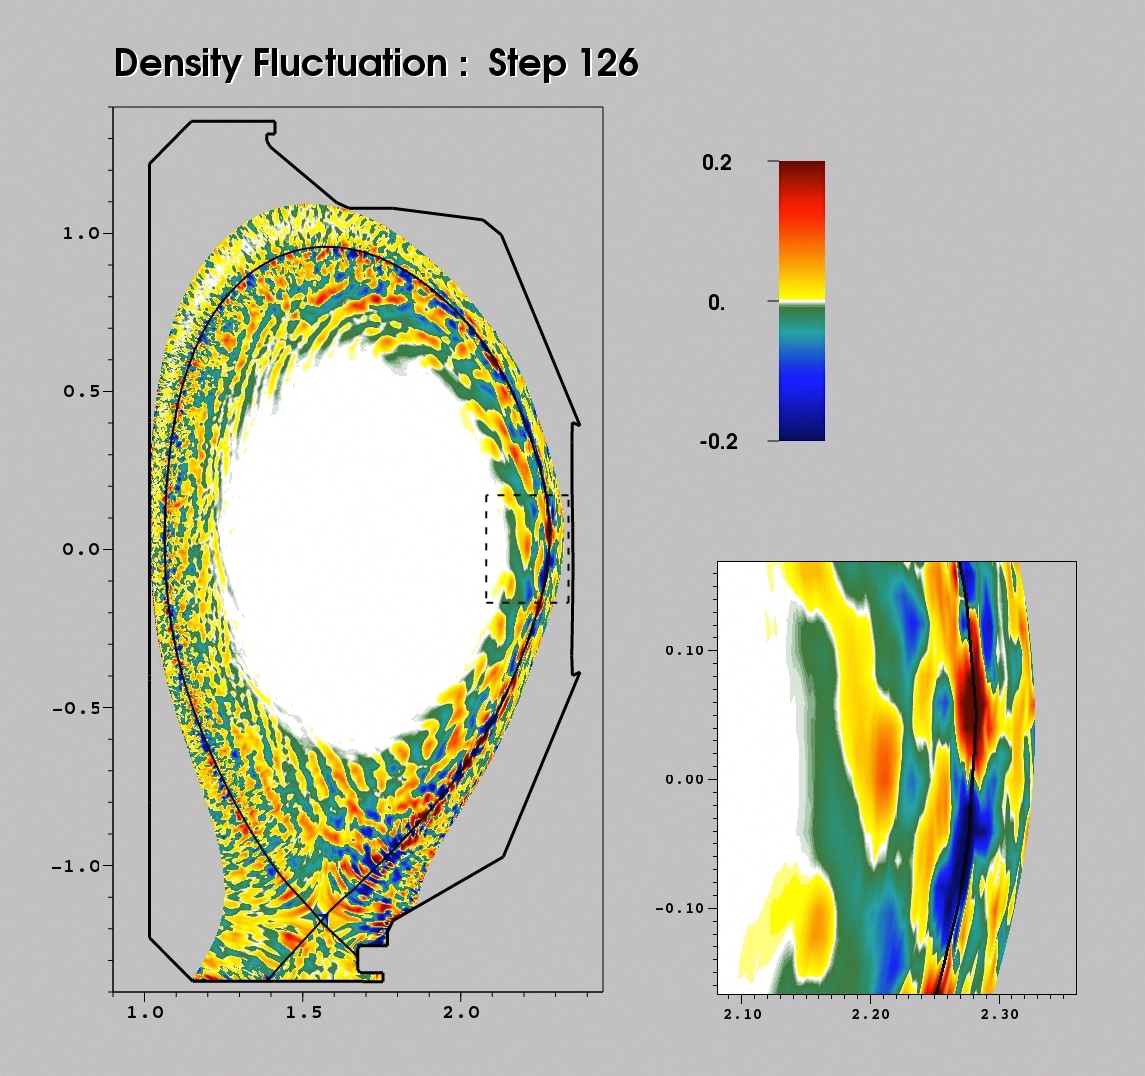
The XGC visualization shows the separatrix and a detailed view of a region of interest near the edge in a
DIII-D simulation. The animation, f(x,y,t), verifies clockwise and counter-clockwise structured movement along
the separatrix down to the X-Point.
Play XGC Animation
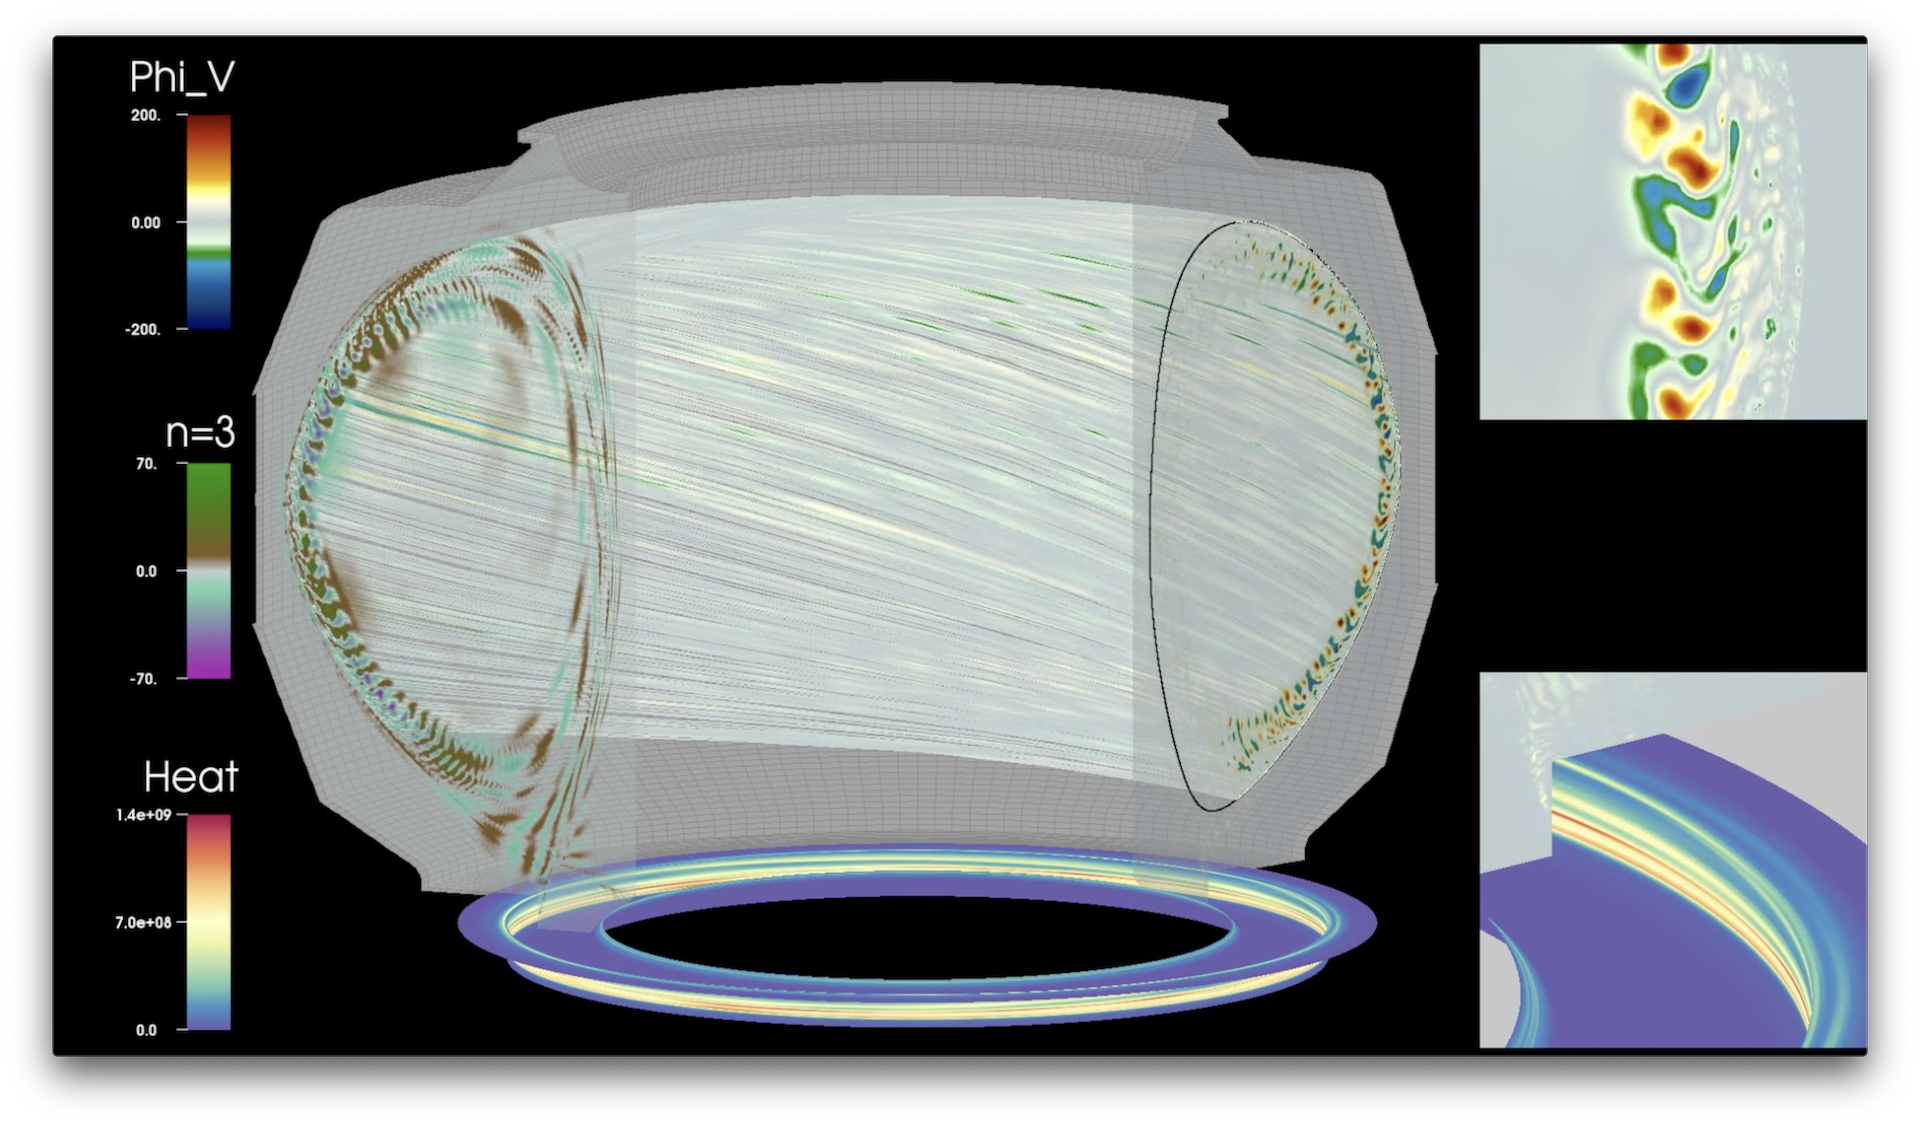
This XGC visualization shows the Phi_V movement along the toroidal surface corresponding to the last
closed magnetic fieldline shown in the poloidal plane on the right.
Selective transparency on the poloidal planes enables seeing more of the toroidal surface.
The upper right inset is a detailed view of the edge of the mid-plane in a DIII-D simulation.
The lower right inset shows the evolving heat load on the divertor. The animation, f(x,y,z,t), verifies
clockwise and counter-clockwise structured movement along the separatrix down to the divertor.
Play XGC Animation with Divertor
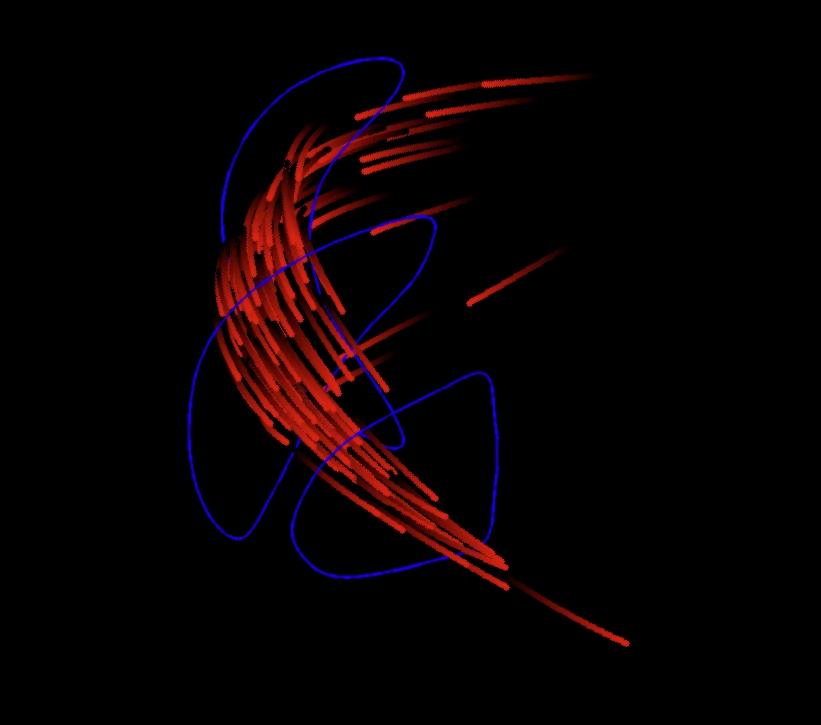
Particle streams from a stellarator simulation are shown relative to 3 cross sections. Given the complex
geometry, the animation provides visual verification of the particle paths. Particles that escape are shown in blue
at the beginnning of the animation.
Stellarator Particle Animation
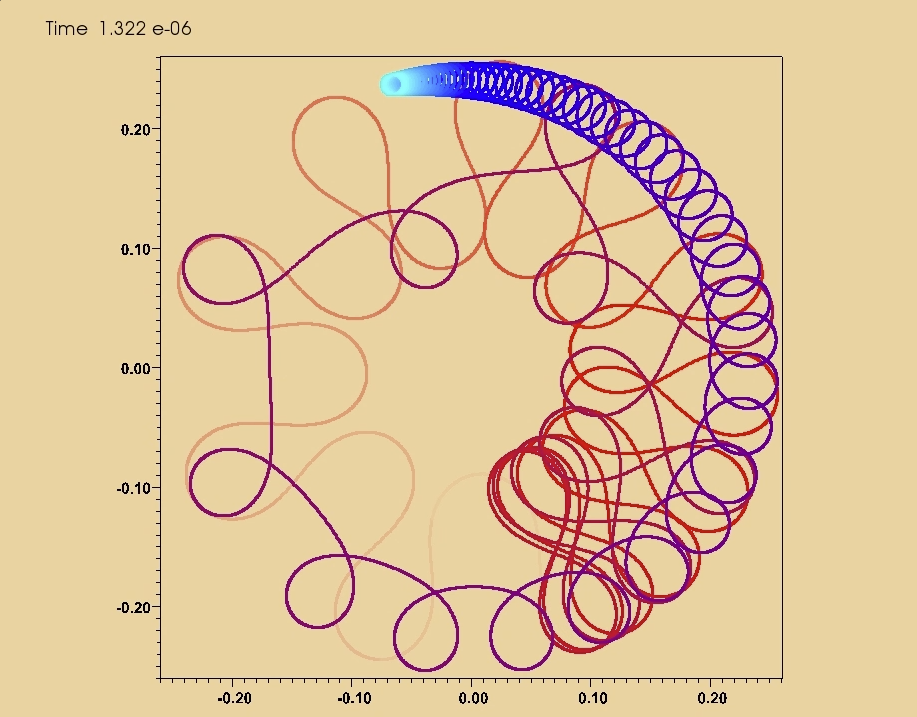
Visualization of a proton as its trajectory changes from betatron to figure-8 to cyclotron.
The FieldCoils code computes the fast-ion slowing in a Field-Reversed-Configuration device.
In the animation the proton's newest location is color-coded light blue.
Its history trail becomes dark blue, magenta, and finally red (oldest).
The oldest section of the history fades out as time advances to declutter the picture.
Single Particle Animation Time Axis Visualization
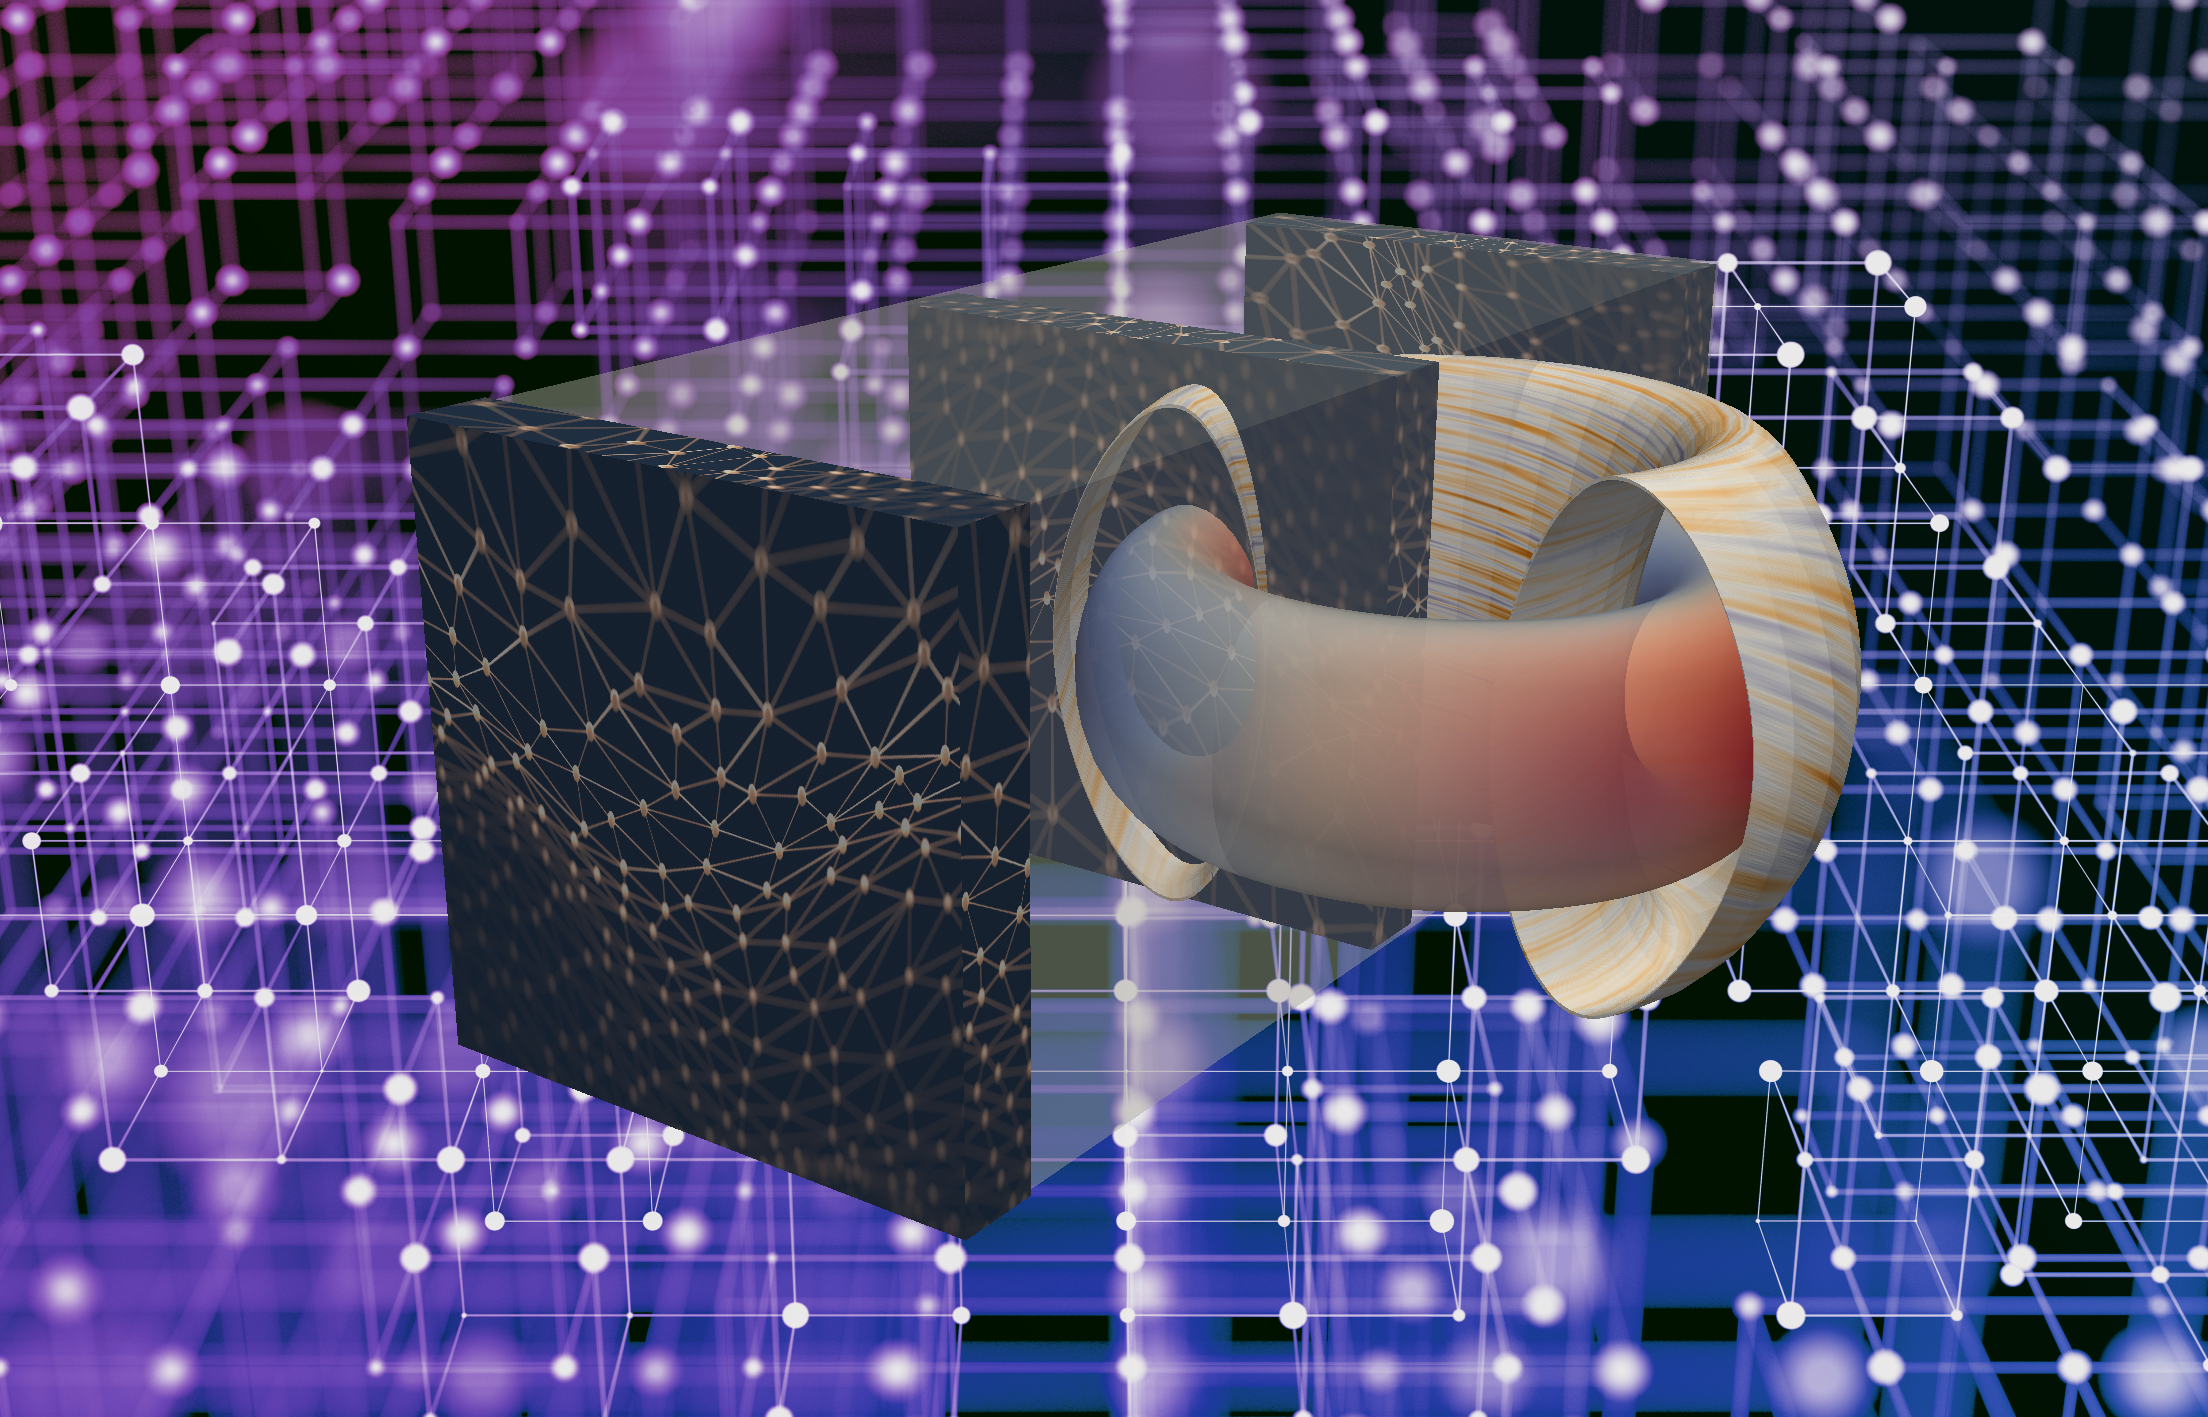
Illustration for Nature article combines NSTX-U gyrokinetic visualiztion with conceptual representation of a
deep-learning neural network.
Predicting disruptive instabilities in controlled fusion plasmas through deep learning
Figure - System overview and workflow
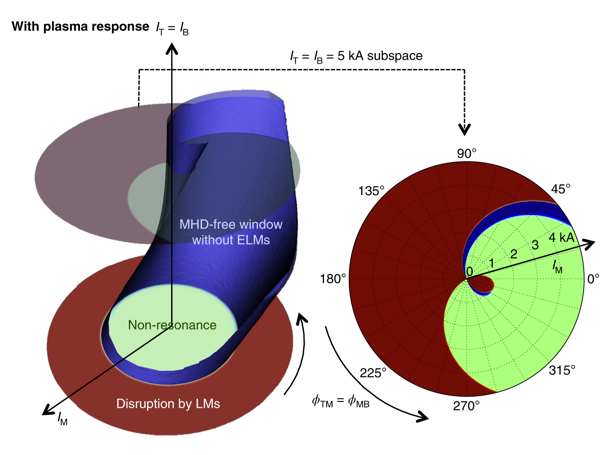
Illustration for Nature Physics article by J.K. Park.
Visualization was effective for identifying stable 3D field-operating window.
3D field phase-space control in tokamak plasmas (co-author) Entire figure

Seminar presentation

I was selected to be an early developer for the Microsoft Hololens augmented reality headset. I directed
student interns who developed prototype applications. They portray life-size models of the NSTX-U
centerstack surrounded by plasma facing components as well as magnetic field flux surfaces from W7-X.
Augmented Reality video of NSTX-U
Acknowledgements
The animation shows visualization techniques for exploring data that is f(x,y,z).
Python scripts were developed to produce each frame of the animation.
Play 3-D Animation (includes audio narration)

The M3D-C1 visualization shows 3 parameters computed on poloidal planes and an isosurface for Te = .015 at a
particular time step. The animation shows these values simultaneously as f(x,y,z,t).
Play M3D-C1 Animation M3D-C1 visualization instructions

The XGC visualization shows the separatrix and a detailed view of a region of interest near the edge in a
DIII-D simulation. The animation, f(x,y,t), verifies clockwise and counter-clockwise structured movement along
the separatrix down to the X-Point.
Play XGC Animation

This XGC visualization shows the Phi_V movement along the toroidal surface corresponding to the last
closed magnetic fieldline shown in the poloidal plane on the right.
Selective transparency on the poloidal planes enables seeing more of the toroidal surface.
The upper right inset is a detailed view of the edge of the mid-plane in a DIII-D simulation.
The lower right inset shows the evolving heat load on the divertor. The animation, f(x,y,z,t), verifies
clockwise and counter-clockwise structured movement along the separatrix down to the divertor.
Play XGC Animation with Divertor

Particle streams from a stellarator simulation are shown relative to 3 cross sections. Given the complex
geometry, the animation provides visual verification of the particle paths. Particles that escape are shown in blue
at the beginnning of the animation.
Stellarator Particle Animation

Visualization of a proton as its trajectory changes from betatron to figure-8 to cyclotron.
The FieldCoils code computes the fast-ion slowing in a Field-Reversed-Configuration device.
In the animation the proton's newest location is color-coded light blue.
Its history trail becomes dark blue, magenta, and finally red (oldest).
The oldest section of the history fades out as time advances to declutter the picture.
Single Particle Animation Time Axis Visualization

Illustration for Nature article combines NSTX-U gyrokinetic visualiztion with conceptual representation of a
deep-learning neural network.
Predicting disruptive instabilities in controlled fusion plasmas through deep learning
Figure - System overview and workflow

Illustration for Nature Physics article by J.K. Park.
Visualization was effective for identifying stable 3D field-operating window.
3D field phase-space control in tokamak plasmas (co-author) Entire figure

Seminar presentation

I was selected to be an early developer for the Microsoft Hololens augmented reality headset. I directed
student interns who developed prototype applications. They portray life-size models of the NSTX-U
centerstack surrounded by plasma facing components as well as magnetic field flux surfaces from W7-X.
Augmented Reality video of NSTX-U
Acknowledgements