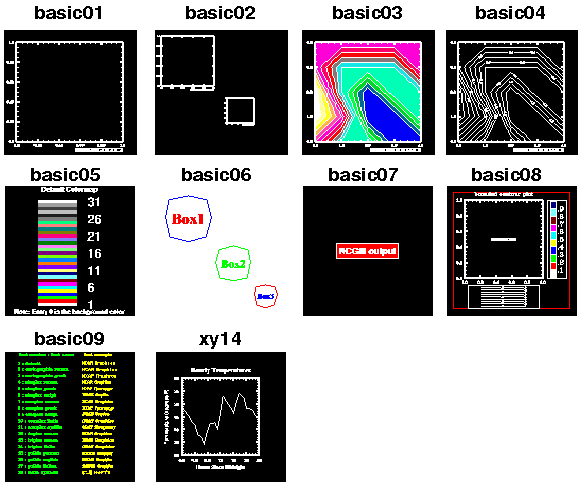

This module is a graphical index to the HLU and NCL NCAR Graphics examples that are used to demonstrate how to get started and how to perform some of the simplest and most common NCAR Graphics operations like manipulating a colormap, creating multiple plots on a single frame, and drawing a plot to different types of output devices.
Click on one of the example graphics below to link to information about how to create the graphic and how to access the code and data that were used to generate the plot.
basic01: How to create a simple plot using default settings.
basic02: How to set the size and location of a plot; how to draw multiple plots on a single frame.
basic03: How to set resources for a plot.
basic04: How to draw to different output devices (NCGM file, X window, etc.).
basic05: How to manipulate a colormap.
basic06: How to size and position objects.
basic07: How to select a workstation device.
basic08: How to draw an object outside its viewport.
basic09: Shows all the available fonts.
basic10: Shows an example of a named color map.
xy14: How to manipulate XyPlot data using NCL.
All of these examples can also be created using the NCAR Graphics Low Level Utilities. See the NCAR Graphics Fundamentals manual and the NCAR Graphics Contouring and Mapping Tutorial for information about using the Low Level Utilities.
NG4.1 Home, Index, Examples, Glossary, Feedback, QSG Contents, QSG WhereAmI?